If you find Excel intimidating, you are not alone.
When it comes to Excel, many of us lack the skills to find the answers we need.
And it’s no secret that subpar Excel abilities could seriously impact your career.
If you work in a non-technical sector, you may wonder why it’s relevant to learn Excel online.
Excel is, in fact, a skill that touches about every profession out there, at every level.
Improving your Excel skills will not only help you get your work done faster, it can also improve your career prospects.
Certified Excel skills have been found to increase the likelihood of promotions and lift earnings by 12% on average compared to the paychecks of non-certified users.
That’s why I learned Excel. And you should too.

Although number crunching is what Excel is known for – its capabilities lie far beyond that. With Excel, you can:
- Organize data in an easy-to-navigate way
- Calculate basic and complex math functions without doing them manually
- Turn piles of data into helpful graphics and charts
- Analyze data and make forecasting predictions
- Create, build, and edit Excel art (yes, creatives use it, too!)
Excel can also help you out in your personal life through expense tracking worksheets, party planning templates, and more.
Interested, but don’t know where to start?
We’ve got you covered.
This overview will guide you through the basics of Excel and teach you how to level up your productivity with key formulas and functions, filtering, macros, and more. We’ve also included 50+ free resources at the end that will help you learn Excel online!
What is Microsoft Excel?
Microsoft Excel is the most widely used spreadsheet program in the world. While it’s most popularly known for its ability to make use of heaps of data, Excel has an infinite number of capabilities, from making lists and charts to organizing and tracking information.
Who uses Excel?
Just about everyone, in so many different ways. Excel is used in virtually every industry, including finance, retail, healthcare, communications, information technology and many more. Excel also comes in handy for personal use to manage your finances, organize your job search, or even plan out a novel! If you’re entirely new to Microsoft Excel, here are some resources you may find useful:
Learn Excel Basics
Before you jump into learning cool things like Macros and Power Pivot, it’s important to get your bearings first.

A Microsoft Office Excel workbook is an xlsx (if you’re using Excel 2007+) file that contains one or more worksheets that you can use to organize different types of related information, according to Microsoft.
Worksheets are comprised of a near infinite number of rows and columns, which together create cells.
Cells are where you store your information, such as text, numbers, pictures, dates, times and formulas.
You’ll notice the rows are numbered while the columns are labeled with letters. An example of a cell label (or reference) then is: A2, H5, etc.
Where to go to get things done in Excel
To get things done in Excel, you’ll need to understand the Ribbon.
- 720p
- 540p
- 360p
- 0.50x
- 0.75x
- 1.00x
- 1.25x
- 1.50x
- 1.75x
- 2.00x
What is the Quick Access Toolbar?
Excel’s quick access toolbar (see screenshot below) gives you one-click access to the tools you use the most in Excel.
You can customize what appears here by clicking on the arrow icon furthest to the right in the left-hand corner.

What is the Ribbon?
The ribbon is a collection of icons at the top of your workbook to help you perform specific actions. Think of the ribbon like a hierarchy, where each tab (e.g. Home, Insert, Page Layout) contains a group of commands (e.g. Copy, Paste, Sort, Filter).


Let’s dive deeper into each of these items.
What are Tabs?
The ribbon (see screenshot) is where you find commands. It’s broken down into clickable tabs, where you’ll find groups of related commands.

It’s important to note that your Excel Ribbon may appear different from my Excel Ribbon. There are a few reasons this could be.
1. Add-ins:
Add-ins extend Microsoft Excel’s capabilities, and therefore, require a new tab.
2. Contextual Tabs:
There are also contextual tabs – or a tab that appears automatically when you do something specific in Excel.

3. Customization:
To make Excel work for you, you can customize your Ribbon, adding and/or removing different tabs.
What are Command Groups?

Depending on which tab you click – home, insert, page layout, etc. – different command groups will appear below.
What things can you do with Excel?
Excel is a powerful and robust program that allows you to accomplish a myriad of things, such as organizing, analyzing, presenting and even automating your data.
Using spreadsheets is usually a three-step process:
Enter data
Do something with
the data
Interpret that data
And occasionally, there is a step four:
Automating the process
Do something with data
Before doing something with your data, try stylizing your spreadsheet so it’s easier to navigate. Here are a few things you should know how to do in Excel.
How to apply conditional formatting
While formatting is essential for easy reading, it’s not the only benefit of the feature.
Ever heard of conditional formatting? Conditional formatting turns things up a notch by styling cells based on what’s in them.
For example, in the example above, we have a spreadsheet with a list of distilleries and the dates they were founded. If I’m interested in visiting the oldest distilleries, I can use the conditional formatting feature to highlight the oldest three in my sheet.

If Excel doesn’t have the option you want already, you can build your own style.
It’s important to note that the style you choose will be applied to every selected cell, so pay attention to the cells you’re selecting because it may affect how the style appears.
How to use freeze panes
We actually touched on this in an article. Here’s an excerpt:
There’s nothing worse than scrolling through a huge spreadsheet that requires you to continuously go back up to the top to see what your column headers are.
Fortunately, you can make your column headers and your row numbers stay right where they are – meaning you can always see them, no matter how far down the spreadsheet you go. You can do this by using Excel’s handy “freeze panes” feature.
Here’s how you do it:
- Click on the row underneath your column headers.
- Click on the “View” tab.
- Click the “Freeze Panes” button.

Scroll down and across your spreadsheet, and you’ll see that the information you need is always right there within view!
What are Formulas & functions?
One of the reasons Excel is so widely used in the business world is because it allows you to do advanced calculations and build business intelligence solutions out of it.
In order to do that, you need to understand formulas and functions. Formulas are the most basic way to do math in Excel.
 Each formula begins with an “=” sign.
How you begin each formula
 If you want to add two numbers, you’d use the “+” sign.
Add numbers
 If you want to subtract two numbers, you’d use the “-” sign.
Subtract numbers
 If you want to multiply two numbers, you’d use the “*” sign.
Multiply numbers
 And if you want to divide two numbers, you’d use the “/” sign.
Divide numbers

You can do what I did above – input the exact numbers – but that isn’t the optimal solution. Why? Because then you can’t copy and paste that formula into the remaining cells because the formula is hard-coded with numbers.
Here’s what I should’ve done instead:

Notice how I input the cell references instead of the actual numbers.
What if you want to do more complex math though? How would you do it?
Well, you’d utilize functions. Functions, which are categorized by functionality, are just predefined formulas. Here are some of the most common ones. You can find the full list here and also here.
-
SUM function
Adds values. You can add individual values, cell references or ranges, or a mix of all three. -
AVERAGE function
Returns the average (arithmetic mean) of the arguments. For example, if the range A1:A20 contains numbers, the formula =AVERAGE(A1:A20) returns the average of those numbers. -
MAX function
Returns the largest value in a set of values. -
MIN function
Returns the smallest number in a set of values. -
COUNT function
Counts the number of cells that contain numbers.
Interpret your data
Now that you have your data, you have to interpret it.
The thing is: it’s difficult to make sense of messy data. So you’ll need to visualize it first.
Here are a few ways you can make your data look better.
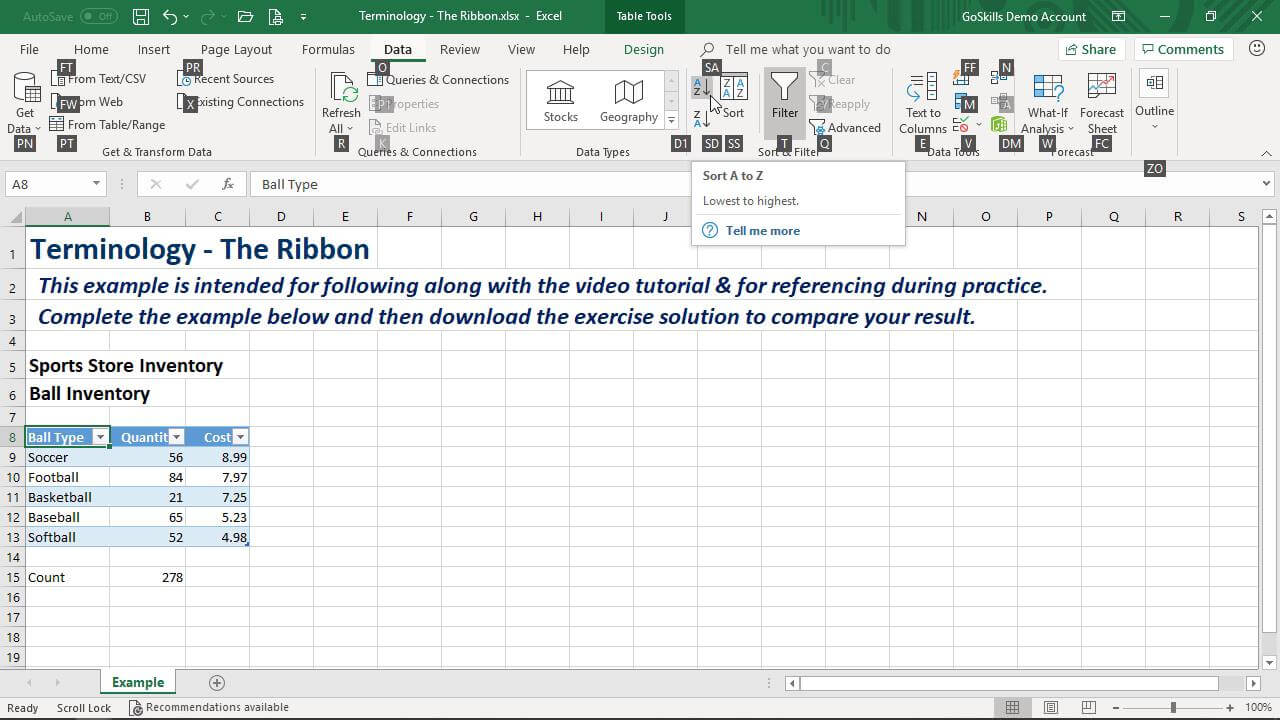
How do you sort data by column?
If you want to sort your data by column/category to make it more presentable, here’s how.
Well, you can do that. Here’s how.
Prepare your data to be sorted
Before you can sort your data, you must make sure that your data is ready to be sorted. Your data is ready to be sorted if the following is true:
- Your data is in tabular format.
- There are no blank rows or columns interrupting the data you want to sort.
- You have a distinct header row for your data. (Optional but highly recommended.)

How to do single level sorts
- Select any cell inside your data table (or the entire range you want to sort).
- Go to Data > Sort.
- Configure the way you’d like it sorted, then click OK.
How to do multiple level sorts
Multi-level sorts are good for large data sets because you’ll likely want to sort your data by one column and then by another.
- Select any cell inside your data table (or the entire range you want to sort),
- Go to Data > Sort.
- Configure the primary sort the way you’d like to see it.
- Click Add Level.
- Configure the secondary sort the way you’d like to sort the ties.
- You can continue to add as many sorting levels as you need.
How to use filtering

Filtering can be very useful for drilling down into data, finding only records that have specific relevance to the situation you are investigating.
To filter out duplicates, again, you must get your data ready to be filtered – make sure:
- Your data is in tabular format.
- There are no blank rows or columns interrupting the data you want to sort.
- You have a distinct header row for your data. (Optional but highly recommended.)
- Select the top row of your data. Go to the Data tab, and choose Filter (this will add a row of drop-down arrows to your headers).
Filter for specific words
- Click the drop-down arrow of the column you wish to filter.
- In the Search box, type the term you are looking for, then click OK.
Filter for specific dates
- Click the drop-down arrow of the column you wish to filter.
- Uncheck the Select all box to clear unwanted dates, then use the checkboxes to drill down to the records you wish to see.
Filter multiple columns
- You can add filters to multiple columns, drilling down to an ever-decreasing amount of records.
Clear filters in one of three ways
- Click the filter icons on the column headers, then click the “Clear filter from” button in the menu.
- Go to the Data tab and click the Clear icon on the Sort & Filter group.
- Go to the Data tab and turn off filtering by clicking the Filter button, then add the filter back again.
What is a Pivot Table and how do you use it?
- 720p
- 540p
- 360p
- 0.50x
- 0.75x
- 1.00x
- 1.25x
- 1.50x
- 1.75x
- 2.00x
A Pivot Table is almost like a Rubik’s cube because it allows you to mold your data and look at it in different ways.
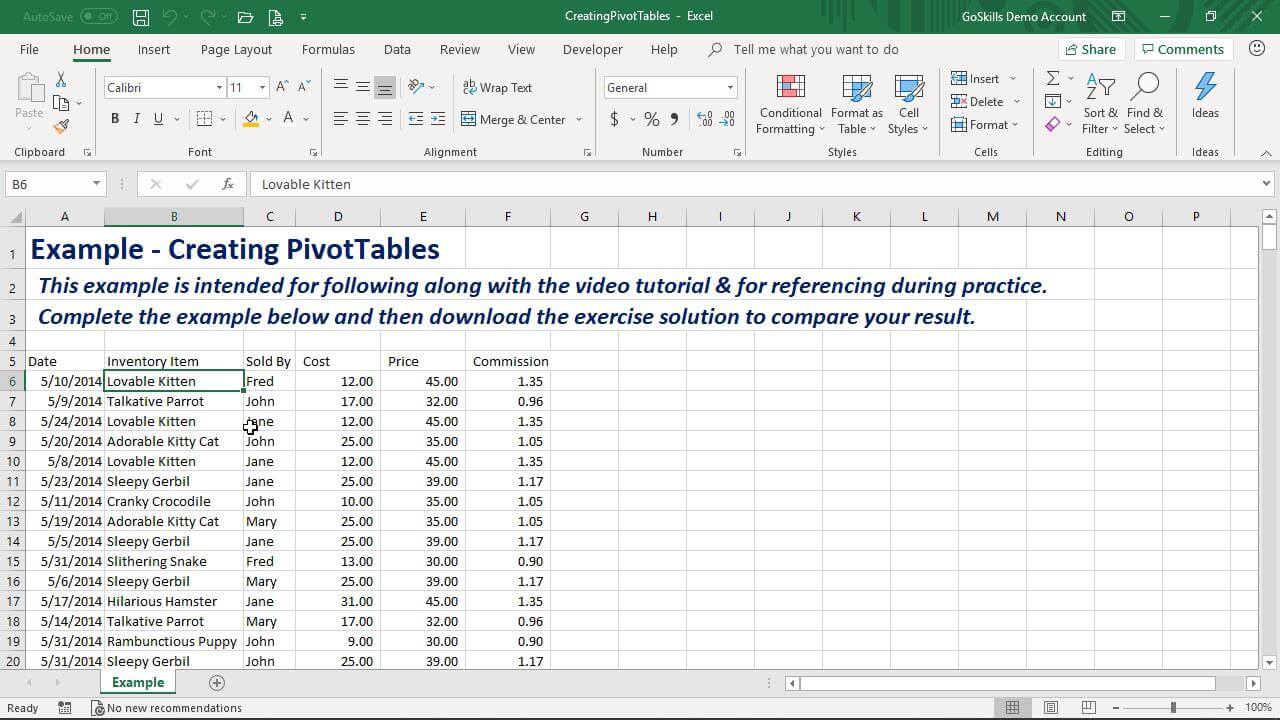
How to create a PivotTable
- Select any cell in the data range.
- Go to the Insert tab, choose PivotTable and place it on a new worksheet.
- Drag a numeric field into the VALUES area.
- Drag fields containing text into the ROWS area as desired.
How to remove items from a PivotTable
- Drag any field from the layout area back into the field list.
How to modify PivotTables
- Drag a field from ROWS to COLUMNS.
- Drag a field from COLUMNS to ROWS.
- Click the arrow beside any field in the VALUES area, choose Value Field Settings, and choose Average.
- Go back to the source data and update any cell to a new value.
- Return to the PivotTable, right click it and choose Refresh.
For more PivotTable tutorials, check out our resources section below.
How do you automate data in Excel?
If you have tasks you need to do over and over again, you should use Macros and Scripts to automate this process.
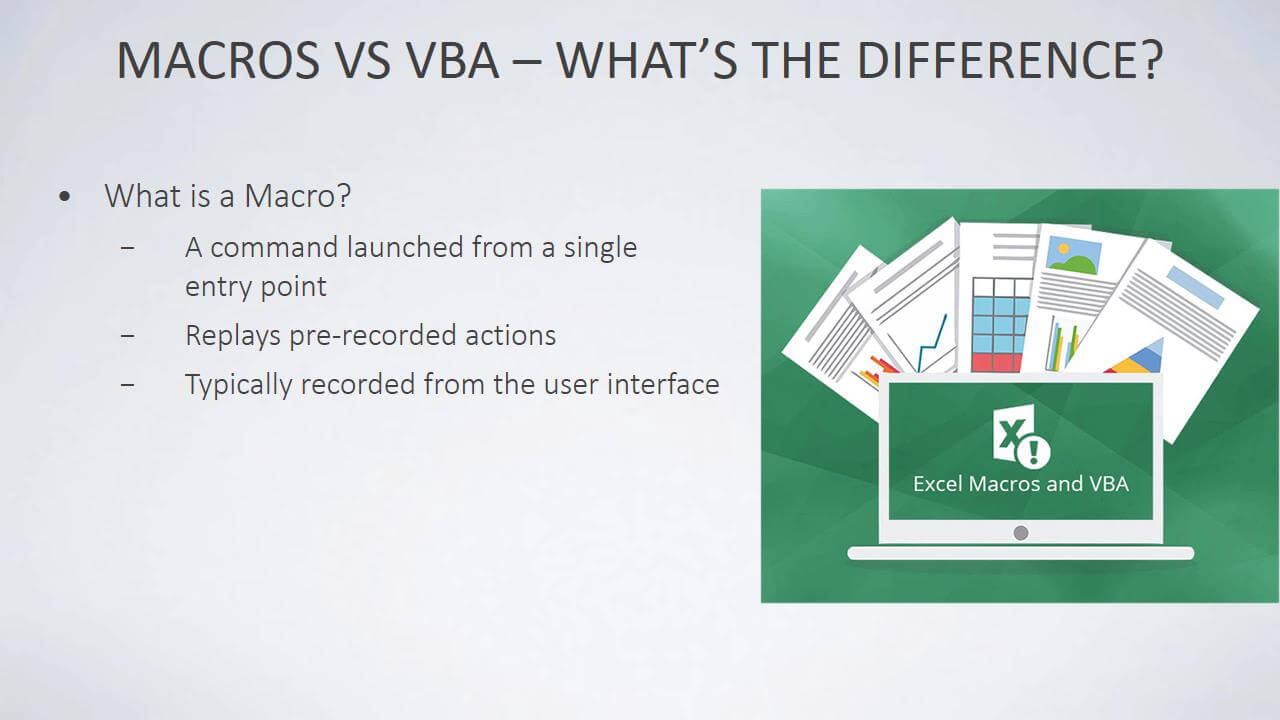
What is a Macro?
A macro is a pre-recorded set of actions that you can replay as many times as you want, so you don’t have to manually take those same steps. You can record a macro for some of your most common tasks in Excel, and replay those actions to save you time.
- 720p
- 540p
- 360p
- 0.50x
- 0.75x
- 1.00x
- 1.25x
- 1.50x
- 1.75x
- 2.00x
How to record Macros
Add the Developer tab to your ribbon (if it is not on your ribbon)
- Right click any command on the ribbon and choose “Customize Ribbon.”
- Click the box next to Developer tab in the list on the right.
- Click OK to return to Excel and activate the Developer tab.
Prepare to record
- Practice the steps you will go through, as the macro recorder will record your mistakes!
- Be aware that the macro will do EXACTLY the same thing EVERY time it runs (this can be modified, but it involves learning to program).
Record a macro
- On the developer tab, click “Record Macro.”
- Give the macro a name (no spaces) and add a capital letter in the Shortcut box (like R) if desired.
- Choose to place the macro in ThisWorkbook.
- Perform the tasks that you want the macro to do.
- On the Developer tab click “Stop Recording.”
Run the macro
You can run the macro in any one of three ways:
- Press CTRL+SHIFT+
R (or whatever letter you chose) to run the keyboard shortcut. - Press Alt+F8 to run the macro from the macro dialog.
- Go to the Developer tab and choose to Insert a Form Control Button on the worksheet (it will prompt you to connect a macro to it). You can then click the button to run the macro.
For more Macros and VBA tutorials, check out our resources section below.
50+ free resources to learn Excel online
This was a high-level overview, but the possibilities of Excel are endless, so don’t stop here.
We’ve gathered 50+ free Excel resources to keep you moving, including step by step tutorials, keyboard shortcuts, and time-saving templates.
If you’re looking for something more comprehensive, we’ve also included online courses that will help you learn and apply your new skills, fast.
Templates, shortcuts, and add-ins
Use these templates, shortcuts, and add-ins to work smarter and save yourself valuable time.
- 200 Best Excel Shortcuts for PC and Mac
- 50 Best Excel Add-Ins That Will Make Your Life Easier
- 52 Free Excel Templates to Make Your Life Easier
- 33 Excel Business Templates for Workplace Productivity
- Excel Gantt Chart Template
- Excel Tax Tracker Template
Beginner tutorials
Make use of these Excel tutorials for beginners or those needing a refresher on the essentials.
Video tutorials
- The Ribbon (PC) | The Ribbon (Mac)
- Math Functions (PC) | Math Functions (Mac)
- Building Column Charts (PC) | Building Column Charts (Mac)
Resources
- 6 Things You Should Absolutely Know How to Do in Excel
- Best Excel Tips for Beginners
- Excel Hacks You Need to Know Now
- Best Excel Presentation Tips
- How to Master Excel in 11 Steps
Webinar
Courses
- Excel - Basic (PC)
- Excel - Basic & Advanced (PC)
- Excel - Basic(Mac)
- Excel - Basic & Advanced (Mac)
- Excel for Marketers
Intermediate/Advanced tutorials
Once you’ve mastered the basics, try your hand at learning these intermediate and advanced skills.
Video tutorials
- How to Create Tables
- Understanding Dates (PC) | Understanding Dates (Mac)
- Applying Styles (PC) | Applying Styles (Mac)
Resources
- The Ultimate Guide to Excel Charts
- Why You Should Be Using INDEX MATCH instead of VLOOKUP
- 9 Best Excel Skills for Accountants in 2020
- How (and When) to Use ANOVA in Excel
Courses
- Excel - Advanced (PC)
- Excel - Advanced (Mac)
- Financial Modeling Basics in Excel
- Financial Modeling Techniques in Excel
For more intermediate and advanced resources, see the sections below, organized into specific categories.
Pivot Tables tutorials
Learn how to use one of Excel’s most indispensable tools, the Pivot Table, to analyze and present your data in an understandable way.
Video tutorials
- What is a PivotTable - and Why Do You Care?
- Creating PivotTables (PC) | Creating PivotTables (Mac)
- Using Excel Ranges
- PivotTable Styles
Resources
Courses
Macros and VBA tutorials
Learn how to automate your most repetitive tasks by creating powerful macros with VBA.
Video tutorials
Resources
- The Beginner’s Guide to Excel Macros
- Excel VBA - Advanced Filtering Tutorial
- Excel User Defined Functions Examples
Courses
Dashboards tutorials
Learn data visualization skills to design and build dynamic and beautiful Excel dashboards.
Video tutorials
Resources
Courses
Power Query tutorials
Learn how to use Power Query, a business intelligence tool within Excel that allows you to extract, clean, and reshape your data to prepare it for analysis.
Video tutorials
- What is Power Query and What Does it Do?
- Append Objects Within the Current Excel Workbook
- Unpivoting Data
Resources
Courses
Power Pivot tutorials
Learn how to use Power Pivot, a business intelligence tool within Excel that allows you to transform large data sets into supercharged tables for data analysis and modeling.
Video tutorials
Resources
Courses
Power BI tutorials
More advanced Excel users who are working with tools like Power Query and Power Pivot to clean and analyze their data may also be interested in Power BI. You can import data from your Excel files into Power BI to build beautiful and interactive reports and dashboards.
Video tutorials
Resources
Courses
We hope the resources above will help you in your quest to learn Excel online. Check out our resources section and sign up for our newsletter to get notified of new articles, tutorials, and webinars.
Ready to learn more about Excel and add a certification to your resume? Browse our online Excel courses today.