
In this resource, we’ll take a look at Lean Six Sigma value stream mapping.
A value stream map is a flowchart tool that shows the steps and inputs of a process that delivers a product to a customer.
Different symbols represent different types of activities. Value stream maps are typical tools in Lean process improvement projects because the process map should show both steps that add value and steps that add waste.
When you use a value stream map that shows your current process, you typically create a corresponding map that shows the most ideal state of the process you can conceive. The differences between the two maps help to guide your process improvement efforts.
When to use a value stream map
The process of making a value stream map has a variety of benefits. In almost all cases, you begin by creating a map of the current state of a process.
Benefits of mapping the current value stream
Differentiate value from waste: As you map the steps in your process, you can see which steps add value and which are waste. In general, every step either adds value or is waste.
Agree on the value stream: The more complex a stream, the more disagreement there will be on how it works. The creation of a value stream map gets everyone to agree. This agreement makes it easier to move forward with improvement projects.
Download your free value stream map templates
Free value stream map templates to help you with your value stream analysis
How to use a value stream map
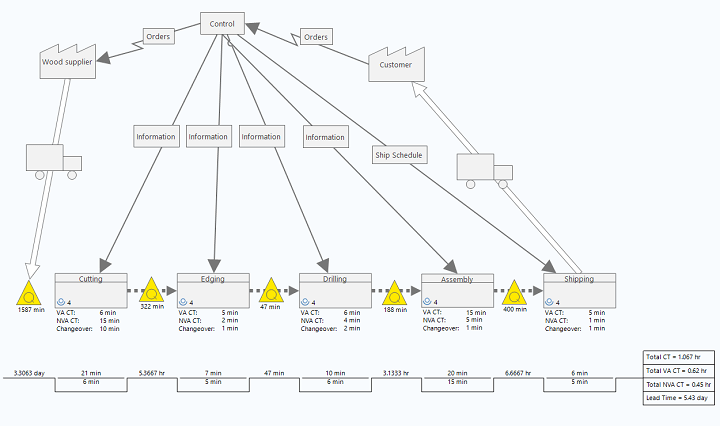
In many projects, the excitement comes when it’s time to compare the value stream map that shows the current process to the value stream map that shows the ideal. The comparisons highlight the areas of opportunity. Consider the following two maps for a stream that delivers cabinets.
This first value stream map shows the current state of the process:
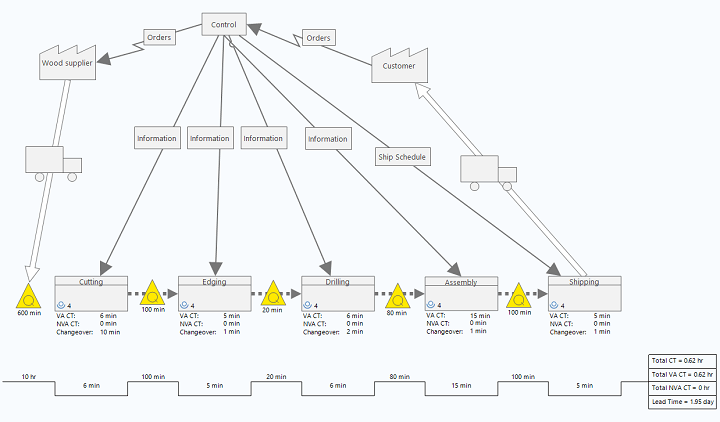
 The second value stream map below shows the ideal state of the process that the same team created. The largest changes in minutes are in the waiting times between process steps. Wait times look like the place to focus improvement efforts.
Value stream mapping symbols
The value stream mapping examples in the previous section show some of the most common value stream mapping symbols.
The more common a symbol is, the more likely that the symbol has wide adoption. On occasion, you might need to come up with a symbol that you haven’t seen before.
For example, you might decide that you need an arrow that shows when an order comes from a web form instead of the generic arrow for electronic communication.
Common process shapes
|
Shape |
Title |
Description |
|
|---|---|---|---|
 |
Information |
Schedules and orders are two types of information that often have to be communicated to people at different places on a value stream map. This shape is usually the label for an arrow that shows the information flow. |
|
 |
Outside step |
Outside steps are almost always suppliers or customers. Suppliers receive orders (information) and provide material. Customers send orders and receive finished goods. |
|
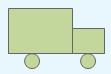 |
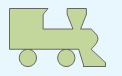
Truck |
Transportation by truck is usually a label for an arrow that shows the movement of finished goods. |
|
 |
Process |
Process shapes represent machines and internal process steps, among other things. Often they include additional data, such as the number of workers involved and cycle time. |
|
 |
Inventory triangle |
Typically found between process shapes, the inventory triangle describes the amount of work-in-progress material waiting to be used. High amounts of inventory can signal waste. |
|
 |
Waiting triangle |
Typically found between process shapes, the waiting triangle describes the amount of time spent waiting before the next process step begins. High amounts of waiting can signal waste. |
Common arrow shapes
On a value stream map, different styles of arrows describe the movement of information, materials, and goods.
Information arrows
|
Shape |
Title |
Description |
|---|---|---|
|
Manual information flow |
The manual information flow arrow typically shows written or oral information. |
|
Electronic information flow |
To distinguish electronic information from paper information, use a jagged arrow. For example, the process map might need to show that customer orders come from emails. |
Arrows about goods and materials
|
Shape |
Title |
Description |
|---|---|---|

|
Finished goods arrow |
A hollow arrow shows the movement of finished goods. A transportation shape usually serves as a label for the arrow. Most finished goods are raw material from the supplier or finished goods for the customer. |
|
Push arrow |
When work-in-progress material moves from one step of a process to another as soon as it is complete, use square dots for the line of the arrow. |

|
Pull arrow |
When work-in-progress material is pulled from a previous step to the next, use a circular arrow. Pull arrows are more common in processes that include supermarkets or safety stock where material can be stored until it is needed. |
Storage shapes
|
Shape |
Title |
Description |
|---|---|---|
|
Safety stock |
Safety stock is set aside so that work-in-progress material or finished goods are ready in case of a process interruption. |
|
Supermarket |
A supermarket stores material until the next downstream process needs more. Then, workers pull what they need. The open ends of the symbol face the upstream supply. |
|
FIFO flow |
FIFO stands for First-in-First-out. In this storage, material is stored so that whatever enters first leaves first. |
Kanban shapes
Usually, amounts of material are noted on kanban shapes.
|
Shape |
Title |
Description |
|---|---|---|
|
Production kanban |
The production kanban is a signal to represent when an upstream process should produce a certain amount of material for a downstream process. |

|
Withdrawal kanban |
The withdrawal kanban is a signal to represent when a downstream process should remove a certain amount of material from a supermarket. |

|
Batched kanban |
Batched kanban represents kanban that moves in batches. |

|
Signal kanban |
The signal kanban represents a point in the process where upstream production is triggered by material falling to a certain amount. |

|
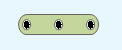
Kanban post |
The kanban post represents a collection point for kanban. |

|
Kanban path |
The kanban path shows how kanban moves through the value stream. |
Detailed transportation shapes
While the truck is the most common transportation shape, more specific shapes can be useful. These shapes can show movement of finished goods or work-in-progress material.
|
Shape |
Title |
Description |
|---|---|---|
|
|
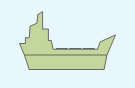
Boat |
Usually for finished goods, the boat shows transportation by sea. |
|
Rail |
Usually for finished goods, the rail shows transportation by train. |

|
Airplane |
Usually for finished goods, the airplane shows transportation by air. |
|
Conveyor belt |
Usually for work-in-progress material that’s transported by conveyor belt. |
|
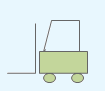
Forklift |
Usually for work-in-progress material that’s transported by forklift. |

|
Cart |
Usually for work-in-progress material that’s transported by cart. |

|
Hand carry |
Usually for work-in-progress material that’s transported by someone carrying the material. |
Other shapes
|
Shape |
Title |
Description |
|---|---|---|
|
Work cell |
Shows the close arrangement of processes, people, and equipment. The goal of the arrangement is to increase efficiency. |
|
Load leveling |
The load-leveling shape shows where the amount and mix of kanbans are adjusted to level production volume. |

|
Sequenced-pull ball |
The sequenced pull ball is used instead of the supermarket when you produce a certain amount of upstream material in response to a customer’s order. |

|
Kaizen burst |
The kaizen burst shows where there is an opportunity to improve the value stream. |

|
Human observation |
Eyeglasses show a place in the process where a person has to go and collect information. For example, if someone counts inventory. |
|
Decision |
A diamond shows a place in the process where a decision has to be made. |
How to conduct a value stream analysis
The value stream considers the end-to-end process of delivering a product or service with a deliberate focus on the identification of what creates value for the customer.
 Long books are written that give extensive guidance on this topic, but you can get an overview from the following steps.
1. Identify a product or product family
In most cases, value stream analysis considers one product or product family. You have a product family to consider when multiple products go through similar value streams. For example, the value stream maps shown earlier are for producing cabinets, but the same company might use those steps to also produce tables and desks. To determine product families, you’ll often create a matrix that looks at products and processes, sometimes called a product family matrix or a product-process matrix.
Value stream mapping examples
See the determination of a product family in Design of a Flexible and Lean (FLEAN) Machining Cell: Part 2 (Application).
2. Get your team and get buy-in
Although scale certainly matters, the traditional perspective is that the analysis of the value stream is a serious effort. Your team will need involvement from people across the entire stream and enthusiastic support from management. Once you’ve recruited a team that believes in the undertaking and you have support from managers, you’re ready to analyze the value stream.
3. Define the value stream
Typically, you’ll see value streams begin with the procurement of raw materials and end with the delivery of finished goods to the customer.
The idea of the value stream depends particularly on how you define the customer. When you define who the customer is, you can see what they value. Customer value determines what is waste and what is valuable.
Value stream mapping examples
- At a furniture company, you can see a traditional definition of the supplier and customer. At the beginning of the value stream are incoming wooden panels. At the end of the value stream are customers who purchase finished goods.
- In a project on handling surgical specimens, the supplier is the operating room where the specimens come from. The customer is the pathology lab that receives the specimens.
4. Walk the stream
Observing the value stream yourself is critical. Before you and your team walk the stream, you might meet to review preconceptions, types of data to collect, and qualities that the customer values.
While you walk the stream, you’ll begin your value stream map. You’ll probably use a pencil and paper while you walk, then do a more formal map later. Starting from a value stream mapping template can be helpful.
Download your free value stream map templates
Free value stream map templates to help you with your value stream analysis
You and your team might walk the stream several times before you’re satisfied with your results. Some teams will walk the stream both forwards and backwards, hoping to capture different details.
Value stream mapping examples
In a process improvement project on moving chemical compounds from chemistry teams to assay, walking the process includes looking at the process steps, noting changeover times, and recording cycle times.
5. Add and analyze additional data
As you make your process map, you generally collect data on times: changeover times, cycle times, non-value added time, value-added time, etc. Tracking inventory at different process steps is also common.
You’ll make a complete timeline from the beginning to the end of your process. To finish your value stream map, you’ll do some analysis of the data. For example, a common goal is to align cycle time with Takt time so that you know you can deliver as much product as the customer wants. The data is also important for comparing the current and future states.

Value stream mapping software
Value stream mapping software doesn’t only look nice but can do many typical calculations. If you’re just getting started, here are some options that you might consider:
- Lucidchart: With a free account, you can open up a value stream mapping template in Lucidchart. As a value stream mapping software, it offers plenty of shapes and makes their arrangement for presentation easy.
- Smartdraw: Smartdraw includes plenty of templates and shapes for value stream maps, in addition to flowcharts and other charting tools. You can add data to your individual process shapes that are then automatically calculated into complete information about your process.
- Companion by Minitab: Chock full of Lean tools, Companion by Minitab includes templates for different size value streams and a template for comparing current and future state maps. You can add data to your individual process shapes that are then automatically calculated into complete information about your process.
Value stream mapping examples
In the chemical compound project, the value stream map includes data on total cycle time, raw process time, the cycle times for each step of the process, and the waiting times between processes.
6. Generate the map of the ideal value stream
With the clear picture you have of the value stream, you can consider what the value stream map could look like. Create a new value stream map showing this ideal state. Once you have the ideal map, look for the best opportunities for improvement. Then, you can begin your process improvement efforts in earnest.
Value stream mapping examples
- In the example with the furniture company, the comparison of the current and ideal value stream maps highlights bottlenecks that present opportunities for improvement.
- In the chemical compound project, the comparison of the current and ideal value stream maps highlights unnecessary steps and wasted waiting time. That suggests that the process can be reduced from about 48 hours to about four hours.
Ready for more?
Value stream mapping is a powerful tool for understanding your processes, where you can reduce waste, and where you can make the improvements that will help you deliver more satisfaction to your customers.
To learn even more skills and tools for your Lean efforts, enroll in courses at GoSkills. Whether you’re looking to prepare for an IASSC certification exam or to make a bigger contribution to your team, GoSkills has the information that you need.