
Gage Repeatability and Reproducibility studies (Gage R&R) are a type of Measurement Systems Analysis (MSA).
The typical Gage R&R acceptance criterion is that the total measurement variation of a process is less than 30 percent of the process tolerance, but more rigorous applications or more established measurement systems might be acceptable only when the measurement variation is less than 10 percent of the process tolerance.
The total measurement variation comes from two sources:
- Repeatability: variation from the measurement device is measured by comparing measurements by the same person using the same device on the same part.
- Reproducibility: variation from different people is measured by comparing measurements by different people using the same device to measure the same part.

Why are Gage R&R studies important?
Gage R&R studies are usually a precursor to other Lean Six Sigma analyses. Gage R&R studies verify that the measurement system is good enough for you to trust the conclusions of your data.
For example, if you want to be able to use a control chart to monitor when the mean diameter of a bearing changes, you need to be confident that any changes you see are because of changes in the process, not because the measurements are inconsistent.
If you cannot trust your measurements, then you can’t use your data to make decisions or process improvements. Because we comprise the variation of the measurement system from two parts, we generally describe the outcomes of a Gage R&R study that shows the variation as being too large as pointing out one of two problems:
1. Demonstrate that the tool needs improvement
When the measurement system variation is high because of high repeatability, we say that the measurement tool itself is too inconsistent. The tool might need to be calibrated more often, might need repair, or might need to be replaced with a more precise tool.
2. Demonstrate that the operators need more consistency
When the measurement system variation is high because of high reproducibility we say that the differences from one operator to another are too great.
The temptation is usually to blame the least consistent operators in the study, but when the operators represent a random sample from the available operators, the interpretation is different.
The operators in the study are representative of all operators, so when we see operators differences in the Gage R&R study, we expect that variation to represent all of the operators. Improving training for everyone, making the measurements easier to take, or verifying that the operators are all using the same process are possible steps that follow a study where the reproducibility is too high.
Who performs Gage R&R studies?
Although Gage R&R studies have strong roots in automotive manufacturing, they have become a fundamental tool. Gage R&R studies have found their way into nearly every industry where there’s measurement uncertainty. Consider these Gage R&R example applications:
- In a hospital, T. Erdmann et al. use a Gage R&R study to assess measurements of patient temperatures.
- Mithun Sharma et al. use a Gage R&R study to assess measurements of burst strengths of shower cartridges.
- Dominik Krumm et al. use a Gage R&R study to assess measurements of bending stiffness of athletic footwear.
The more complex the measurement system is, the more important it is to be sure the data are trustworthy. Anytime measurement variation can exist, it’s worth making sure that it’s small.
How to perform Gage R&R - the process
 A typical Gage R&R study involves the following, which determines the number of measurements:
- At least three people
- At least ten parts
- At least two measurements by each person of each part.
Note that the preceding numbers are all minimums. The more variability you expect to find from a source of variation, then the more measurements you'll need in order to get a good estimate of that variability. For example, if you expect that it’s hard for people to get the same measurement, then you’ll take more than two measurements by each person on each part.
You might need to make adjustments based on your situation, but these are the general steps:
- Randomize the order that people will take the measurements in.
- Randomize the order that each person will measure the parts in.
- Have each person measure the parts in the assigned order.
- Repeat steps 1-3 for as many measurements as you plan.
How to perform Gage R&R - the software
While you’ll find many templates that make it easy to do Gage R&R calculations by hand, these days it’s more common to use software. A Gage R&R analysis in Excel typically replicates the most traditional calculations. A Gage R&R analysis in a statistical software package, like Minitab Statistical Software, comes with additional insights into the measurement process.
Gage R&R Excel
Begin with a data collection form that lets you record the measurements. A variety of forms exist, but the essential quality is that they put the measurements in a place that makes it easy to calculate the averages and ranges for measurements by a person of one part and of the measurements of a part by different people.
Get your Gage R&R worksheet!
You can follow along with this Gage R&R Excel sample worksheet.
Calculate values from the measurements
- Record the measurements for each part in separate columns in a single row for each person and each set of measurements.
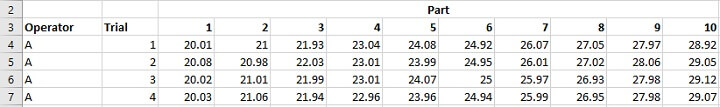
- Calculate the average of the measurements in each column for a person and a part.
- Calculate the range of the measurements in each column for the same person and the same part.
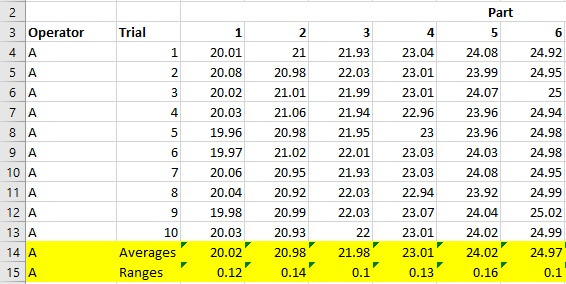
- Calculate the average of the averages for each person from step 2.
- Calculate the average of the ranges for each person from step 3.
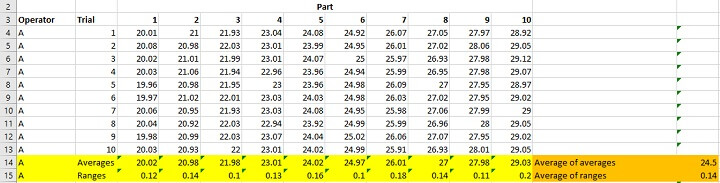
- Calculate the average of all the measurements for the same parts.
- Calculate the range of the averages from step 6, RPart.

Verify that the measurement system is in-control
- Calculate the averages of the ranges from step 5, R̿.
- Calculate the range of the averages from step 4 across all of the people, X̅Range.
- Determine the upper and lower control limits for the ranges with the following Gage R&R formulas:
LCL = R̿ * D4

UCL = R̿ * D3
R̿ is from step 8. D3 and D4 are constants that depend on the number of sets of measurements, given in the following table:
| Number of sets of measurements | D3 | D4 |
|---|---|---|
| 2 | 0 | 3.267 |
| 3 | 0 | 2.574 |
| 4 | 0 | 2.282 |
| 5 | 0 | 2.114 |
| 6 | 0 | 2.004 |
| 7 | 0.076 | 1.924 |
| 8 | 0.136 | 1.864 |
| 9 | 0.184 | 1.816 |
| 10 | 0.223 | 1.777 |
If any of the current range measurements are outside of these control limits, then the measurement system isn’t in control. Stop and correct the measurement system before you estimate the variation.
Estimate the variation from different sources
- Use the Gage R&R formula for variation from repeatability
Repeatability = R̿ * K1
where K1 depends on the number of sets of measurements, given in the following table:
| Number of sets of measurements | K1 |
|---|---|
| 2 | 4.565603 |
| 3 | 3.041937 |
| 4 | 2.501214 |
| 5 | 2.214101 |
| 6 | 2.03236 |
| 7 | 1.904586 |
| 8 | 1.808922 |
| 9 | 1.734007 |
| 10 | 1.673164 |
- Use the Gage R&R formula for reproducibility
Reproducibility = √(X̅Range * K2)2 - (Repeatability2/(nr))
where X̅Range is from step 9, repeatability is from step 11, n is the number of parts, and r is the number of sets of measurements. K2 is a constant that depends on the number of people who take measurements.
| People | K2 |
|---|---|
| 2 | 3.65 |
| 3 | 2.70 |
| 4 | 2.30 |
| 5 | 2.08 |
| 6 | 1.93 |
| 7 | 1.82 |
| 8 | 1.74 |
| 9 | 1.67 |
| 10 | 1.62 |
- Use the Gage R&R formula for the total variation from the measurement system:
R&R = √Repeatability2 + Reproducibility2
- Use the Gage R&R formula for the variation among the parts in the study
VariationParts = RPart * K3
where RPart is the value from step 7. K3 has the same values as K2, but the determining number is the number of parts, not the number of people.
Calculate the total variation and the percentage from each source
- Use the Gage R&R formula for the total variation
Total Variation = √(R&R)2 + (VariationParts)2
where R&R is the value from step 13 and VariationParts is from step 14.
- Divide each source of variation by the total variation to find the percentage from each source.
- Divide R&R by the process tolerance to decide whether the measurement system meets the Gage R&R acceptance criteria.
Gage R&R Minitab
Minitab performs calculations for you, so the results are much faster to produce than in Excel.
Create a data collection sheet
Minitab sets up a Gage R&R worksheet for you so that you can see how to arrange the data in Minitab. The worksheet also shows the random order for measuring the parts.
- Choose Stat > Quality Tools > Gage Study > Create Gage R&R Study Worksheet.
- Enter the number of parts that represent your process.
- Enter the number of operators for your study.
- Enter the number of replicates, which is the number of sets of measurements.
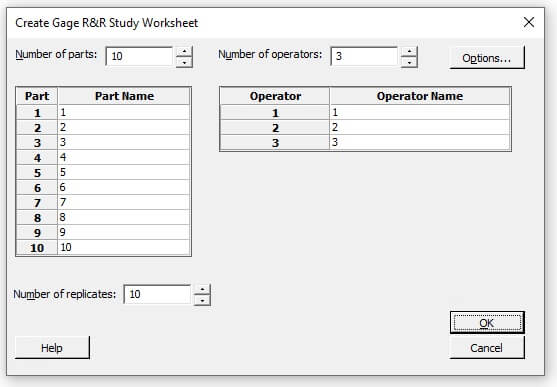
- Click OK.
Produce the results
After you enter your measurements in the correct cells, Minitab completes the calculations for you.
- Choose Stat > Quality Tools > Gage Study > Gage R&R Study (Crossed).
- In the Part numbers field, enter the column that identifies which part was measured in that row.
- In the Operators field, enter the column that identifies which person took the measurement in that row.
- In the Measurement data field, enter the column that contains the measurements.
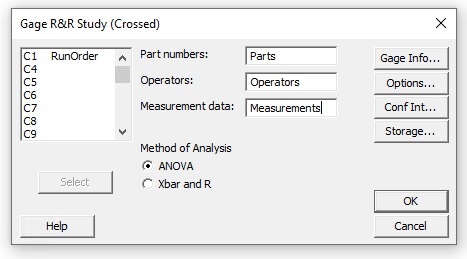
- If you have a process tolerance, click Options. Enter the tolerance in Upper spec - Lower spec.
- Click OK in both dialog boxes.
Gage R&R interpretation
Whether you’ve done Gage R&R yourself or in a software like Minitab, the basic results have the same interpretation. Minitab provides a full graphical report.
Minitab output
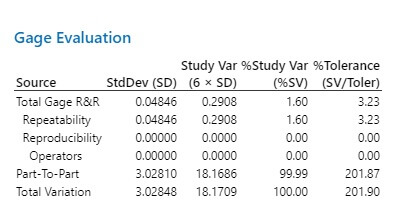
The table output in Minitab shows results where the variation in the measurement system is almost all from repeatability. The variation from the measurement system is about 3 percent of the process tolerance, which indicates a usable measurement system for most applications.
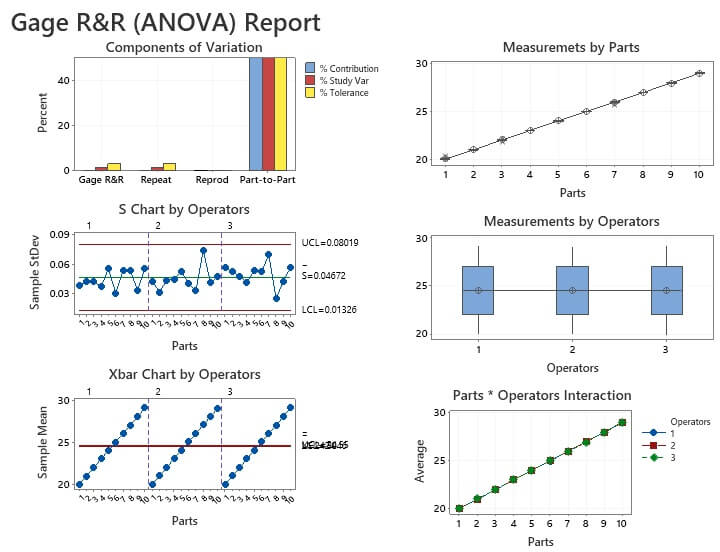
The components of variation graph illustrates the values from the table. The yellow bar that is less than 10 percent on the y-axis shows that the measurement system is adequate. The remaining pieces of the output show the following:
S chart by operators
The S-chart shows whether the measurement system is in-control. You can trust the results from the rest of the study if the S-chart is in-control.
Xbar chart by operators
The example Xbar chart is out-of-control. The out-of-control situation is good because it means that the measurement system is able to distinguish the different parts in the study.
Measurements by parts
The measurements by parts graph provides insight into whether measurement variation is higher for some parts than others.
Measurements by operators
The measurements by operators graph provides insight into the variation among people.
Parts * operators interaction
The parts * operators graph shows whether the measurement variation for some parts is different from operator to operator.
Excel output
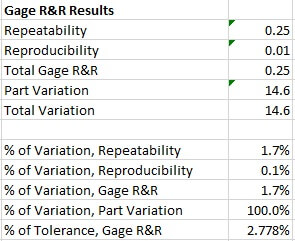
The Excel calculations show that the total Gage R&R represents a small proportion of the tolerance. Because the % of tolerance is less than 10 percent, the measurement system is adequate for the process.
Ready for more?
The Gage R&R study described in this article is usually used for non-destructive testing that looks at the two most common sources of variation for a measurement system. The method is also appropriate only for measurement data as opposed to attribute data that count how often something occurs, like a particular type of defect.
You can learn more about different types of measurements and how to assess their measurement systems in the Measurement Systems Analysis course from GoSkills. You can see a free preview of the Gage R&R Methodology Section that’s well worth watching. After that, you’ll be eager to learn more about how you can make a Gage R&R study work for you.