
Imagine cleaning data, analyzing it, and building a dashboard in just a few minutes. That’s exactly what you’ll explore in this month’s GoSkills Excel Challenge using Copilot in Excel!
You’ll put Microsoft Copilot to the test with an HR dataset and see how much you can accomplish using just a few prompts.
Here’s how to get started:
- Watch the challenge video for a complete overview.
- Review the instructions below.
- Download the Excel workbook and complete the challenge.
- Share your solution with our Excel Slack community.
- Watch the solution video once it drops to compare approaches.
Download the file here
Get the practice exercise to solve this challenge.
The challenge 🧗
Imagine you’ve been handed a messy HR dataset that needs to be cleaned before anyone can use it.
The data contains inconsistent formatting, duplicate values, and other errors. Once you’ve cleaned it, you’ll analyze the data, apply conditional formatting, and build a dashboard for leadership.
The twist? This time, you’ll use Copilot in Excel to complete the tasks with prompts instead of writing formulas manually.
Your mission ✅
1. Clean the dataset
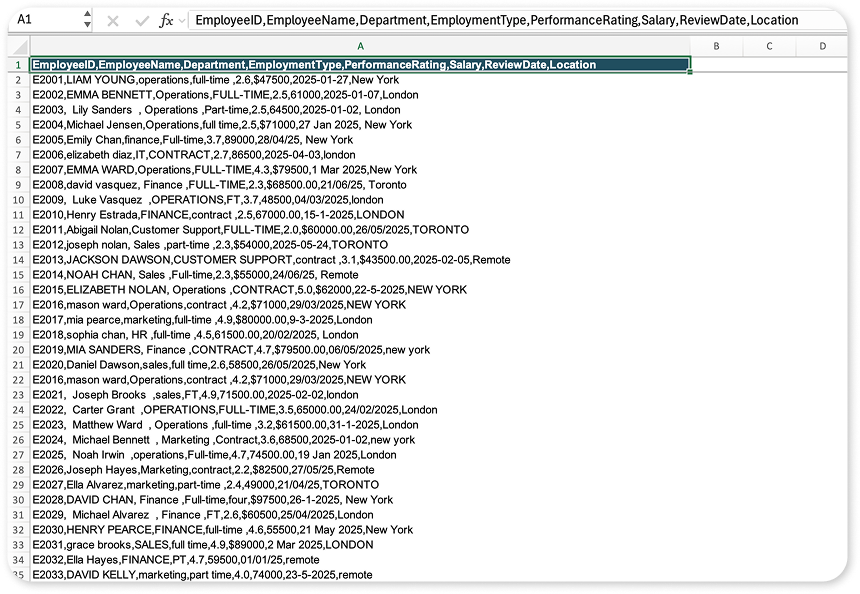
The HR data is currently sitting in a single column and contains multiple inconsistencies.
Use Copilot in Excel to identify and fix the issues, then output the cleaned data as an Excel table.
2. Analyze the data
Next, perform a series of data analysis tasks:
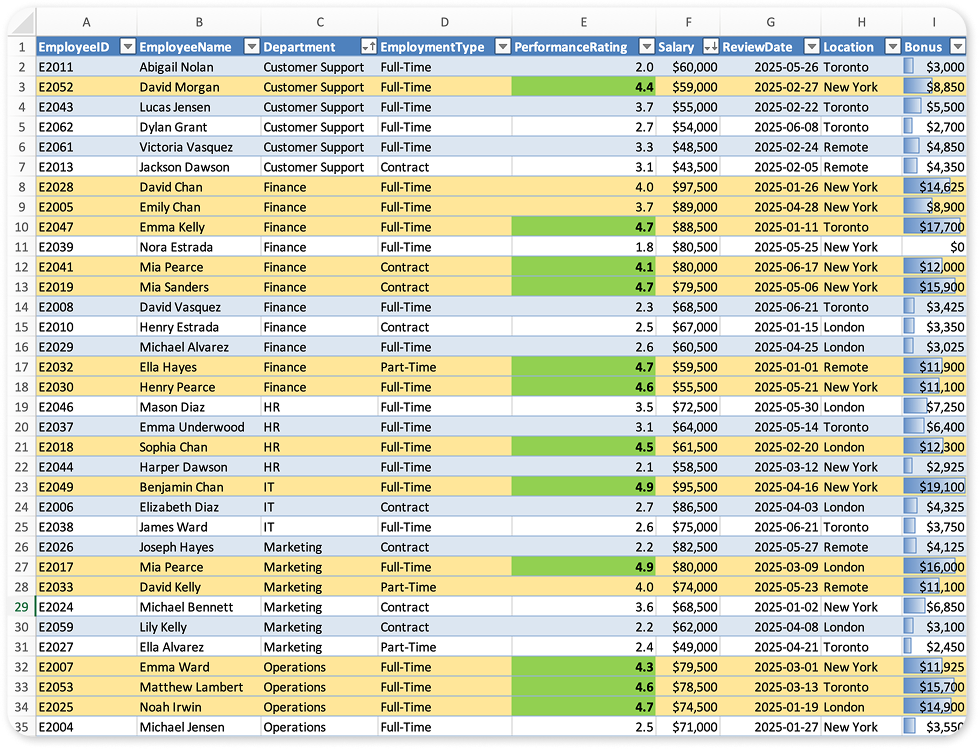
- Sort the data by Department, then by Salary (highest to lowest).
- Add a Bonus column. Match each employee’s performance rating to the corresponding bonus percent in the BonusTiers table, then calculate the bonus using:
Bonus = BonusPercent × Salary - Filter the dataset to show only Contract employees (then clear the filter).
3. Apply conditional formatting
Use Copilot in Excel to:
- Highlight Performance Ratings above 4.0.
- Highlight the entire row for employees whose Bonus is above the average.
- Add data bars to the Bonus column so you can spot top performers at a glance.
4. Build a dashboard
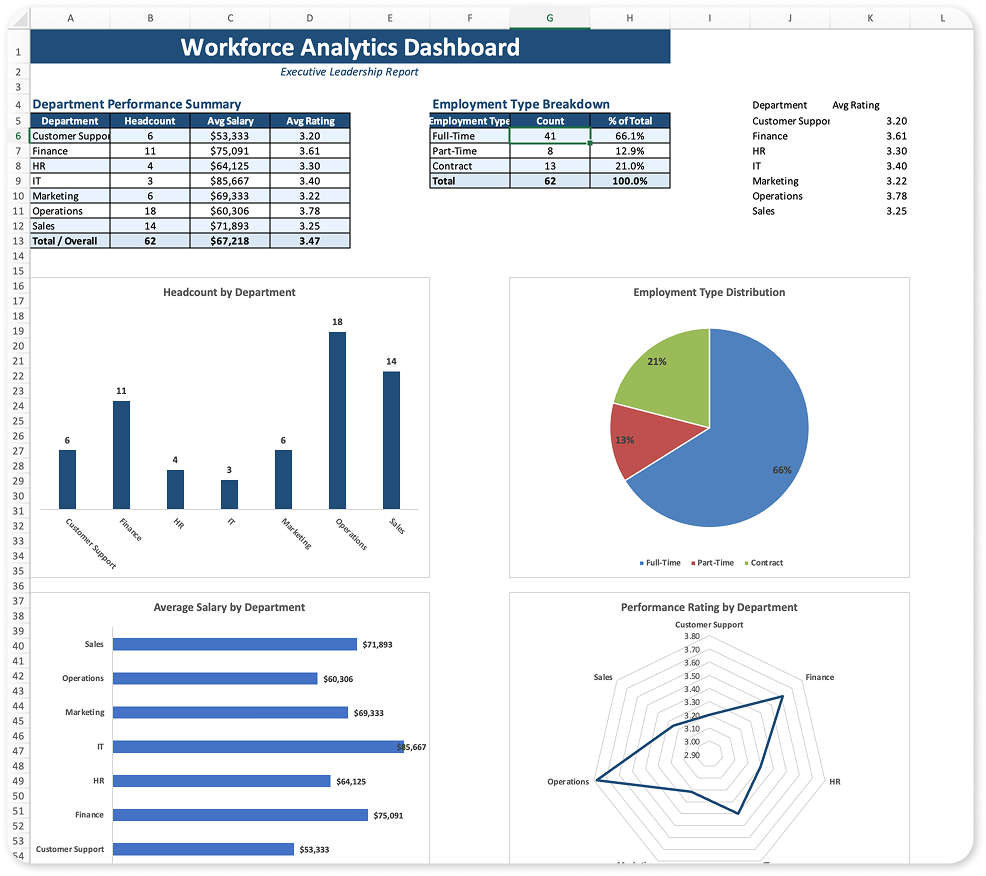
Finally, create a presentation-ready dashboard that includes:
- Headcount by department
- Average salary by department
- Average performance rating by department
- Employment type split
- A radar chart comparing average performance ratings across departments
The hints 🕵️
Need a nudge?
Hint #1: Be specific with your prompts
The more context you give Copilot in Excel, the better your results will usually be.
Instead of asking it to “calculate bonuses,” tell it where to find the BonusTiers table and how the calculation should work. Clear, specific prompts will usually produce more accurate results.
Hint #2: AI isn’t the only answer
This challenge focuses on Copilot in Excel, but every task can also be completed using traditional Excel formulas and features.
If you prefer writing formulas yourself, go for it! The goal is to learn new ways of solving real-world spreadsheet problems.
What is Copilot in Excel?
Copilot in Excel is Microsoft’s AI assistant built directly into Excel for Microsoft 365.
New to Copilot? Learn how to get started with Copilot in Excel before tackling this challenge.
Instead of manually writing formulas or building reports from scratch, you can describe what you want in plain English. Copilot can help you clean data, analyze datasets, write formulas, create charts, summarize information, and even build dashboards.
It’s not a replacement for Excel skills, but it can significantly speed up repetitive tasks and help you explore your data more efficiently.
This challenge gives you a hands-on opportunity to see where Copilot shines!
Can Copilot in Excel replace formulas?
Not entirely.
Many everyday tasks — such as sorting data, applying conditional formatting, generating summaries, or creating charts — can be completed surprisingly well with Copilot in Excel.
However, understanding Excel formulas remains incredibly valuable. Knowing functions like XLOOKUP, SUMIFS, FILTER, and LET helps you verify AI-generated results, troubleshoot issues, and solve more advanced business problems.
The best Excel users aren’t choosing between AI and formulas — they’re learning how to combine both.
The solution ✅
One of the best things about Copilot in Excel is that there isn’t just one correct prompt.
Did you solve the challenge differently?
Share your prompts, your formulas, or even your own challenge idea with our Excel Slack community and compare approaches with fellow spreadsheet enthusiasts.
Need more Excel practice online? 🤩
If you enjoyed this challenge, keep building your Excel skills by exploring more GoSkills Excel Challenges or browsing our Excel blog for tutorials, tips, and hands-on practice exercises.
Want to get even more out of Copilot in Excel? Learn how to use AI across Excel, Word, PowerPoint, Outlook, Teams, OneNote, and more with our Copilot for Microsoft 365 Applications course, taught by Microsoft MVP Deb Ashby.
Keep learning, keep experimenting, and we’ll see you in the next Excel Challenge! 👋

Join the Excel conversation on Slack
Ask a question or join the conversation regarding Excel challenges on our Slack channel.
Join Slack channel