
In the real world, data rarely arrives neatly packaged in a single spreadsheet. One team has one file, another department has its own, and suddenly you’re wondering how to consolidate data in Excel without creating a copy-and-paste marathon.
That’s exactly what this month’s GoSkills Excel Challenge is all about.
You’ll work with expense data from three departments, combine information from multiple Excel workbooks, and create a PivotTable that gives you both a company-wide view and a clear breakdown by department.
Here’s how to get started:
- Watch the challenge video for a complete overview.
- Review the instructions below.
- Download the challenge workbook, then scroll to the “Your mission” section to download the three source workbooks under Task 1.
- Share your solution with our Excel Slack community.
- Watch the solution video once it drops to compare approaches.
Download the challenge workbook
Get the workbook with the challenge instructions and workspace for your solution.
The challenge 🧗
Imagine you’ve been asked to prepare a company-wide expense report.
There’s just one small complication: the data is spread across three different Excel workbooks.
You’ve been given separate files for the following departments (you can download all three under Task 1 in the “Your mission” section below):
- HR expenses
- Operations expenses
- Sales expenses
Each file follows the same structure. You’ll find expense IDs, a department column, an expense column, 12 columns containing monthly expense values, and an additional details column.
Your job is to bring the information together and turn it into a clear, useful report.
Your mission ✅
1. Consolidate the data
Bring together the expense information from all three workbooks so it can be summarized in one place.
Your final report should include data from HR, Operations, and Sales.
Download the source workbooks
You’ll need all three department files to complete the challenge. Click each file name below to download it:
2. Calculate company-wide totals
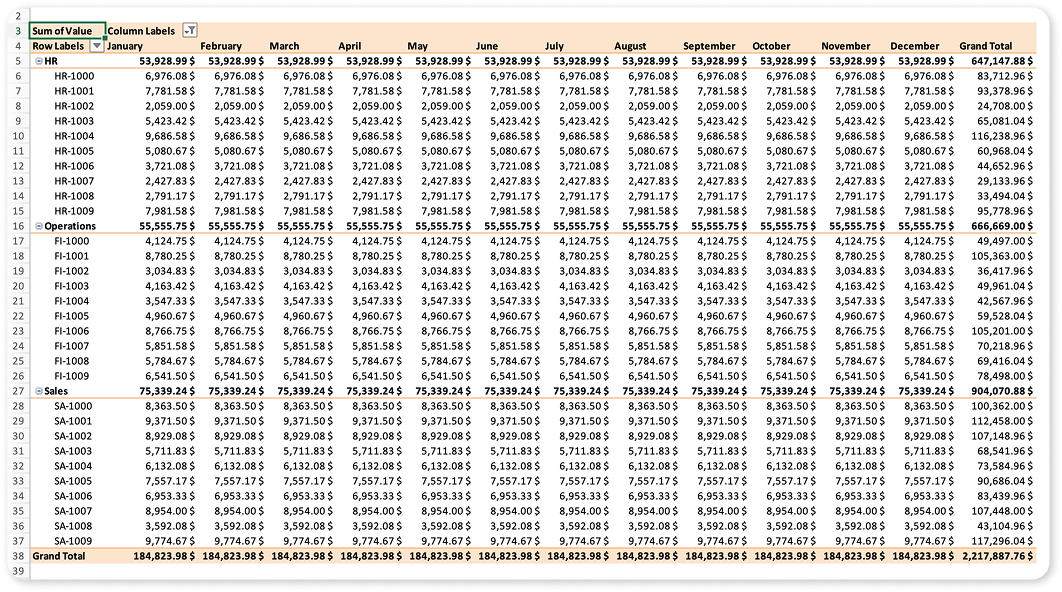
Use a PivotTable to summarize expenses across the entire company.
The finished report should make it easy to see the monthly values as well as the overall annual total.
3. Break down the results by department
A company-wide total only tells part of the story.
Your PivotTable should also allow you to view results for HR, Operations, and Sales separately, so you can see how each department contributes to the total.
The hint 💡
Need a nudge?
When data is stored across several workbooks, your first instinct might be to copy everything into a new worksheet and work from there.
But is there another way?
Excel’s PivotTable tools can work with data from multiple sources, allowing you to summarize similarly structured information without manually copying everything into one worksheet.
That might be worth investigating. 👀
A few concepts worth recapping 📚
1. What does it mean to consolidate data in Excel?
To consolidate data means to bring information from multiple sources together so it can be summarized or analyzed as a whole.
For example, different departments might maintain their own expense files throughout the year. Consolidating those files makes it possible to create a company-wide report without losing the ability to compare results between departments.
2. How to consolidate data in Excel
There isn’t only one way to consolidate data in Excel.
The right method depends on how your source data is structured, how often it changes, and what you need to do with the finished dataset.
Excel offers several approaches for combining or summarizing information, including PivotTables, Power Query, and formulas.
4. Why use a PivotTable?
PivotTables are designed to turn rows and columns of data into useful summaries.
They allow you to calculate totals, group information, apply filters, and rearrange your report depending on what you want to examine.
For this challenge, that means moving between a company-wide expense summary and a departmental breakdown without having to create separate reports from scratch.
The solution ✅
Did you take the same approach?
Or did you find another way to combine the three workbooks and reach the same result?
Share your method with the GoSkills Excel Slack community and compare solutions with other Excel enthusiasts. Sometimes the most interesting part of an Excel challenge is seeing how many different routes can lead to the same answer.
Need more Excel practice online? 🤩
If you enjoyed this challenge, here are two more Excel Challenges where you can practice consolidating data in Excel:
- Excel Challenge 57: Consolidate Data From Multiple Files
- Excel Challenge 59: Consolidate Data From Multiple Sheets
Want to sharpen your PivotTable skills even further? Explore our Excel – PivotTables course to learn more ways to organize, summarize, and analyze data efficiently.
Keep learning, keep practicing, and see you in the next Excel Challenge! 👋

Join the Excel conversation on Slack
Ask a question or join the conversation regarding Excel challenges on our Slack channel.
Join Slack channel