Microsoft Excel 365 - Basic | Online Training Course
Microsoft Excel 365 - Basic
Skills you’ll gain
Excel is a pillar of the workplace, and for good reason. Its versatility enables you to accomplish essential tasks, like tracking KPIs, creating sales receipts, monitoring expenses, and much more.
This course is designed to give you a solid foundation in Excel basics, teaching you how to work smarter, not harder.
In a series of engaging, bite-sized lessons, our award-winning instructor and Microsoft MVP (Most Valuable Professional) Ken Puls will show learners how to:
- Navigate the Excel interface with confidence.
- Boost productivity with essential formulas and shortcuts.
- Organize important data by sorting and filtering.
- Effectively present your data in several chart formats.
- And much, much more!
Regardless of your goals with Excel, this basic course allows you to become savvy and confident at using this powerful tool, and can even help you earn an Excel certification!
Looking for something beyond the basics? Try our Advanced course. And if you'd like to know everything from beginner to advanced lessons, then the complete course is for you.
Syllabus
Download syllabus-
1
Formula Anatomy Understanding Excel Formula Anatomy 6m
-
2
Cell Referencing - Theory Learn about working with absolute and relative cell referencing. 7m
-
3
Cell Referencing - Example See absolute and relative cell referencing in practice, and learn about ways to copy and paste formulas. 9m
-
4
Function Anatomy Use to understand the anatomy of Excel functions and what their components mean. 7m
-
5
Math Functions Learn basic math functions including SUM, ROUND, and SUBTOTAL. 6m
-
6
Basic Statistics Learn basic statistical functions including COUNT, COUNTA, AVERAGE, MAX, MIN, MEDIAN, and MODE. 6m
-
7
Logic Functions Learn to build standalone logical IF functions and make them more complex by nesting AND and OR within them. 6m
-
8
Text Functions Learn to break apart text with the LEFT, RIGHT, MID, FIND and SEARCH functions, and to combine text with the & character. 7m
-
1
Conditional Math Learn to use SUMIF, COUNTIF, and SUMIFS to add cells only when certain conditions are met. 5m
-
2
External Links Learn about creating and updating external links, and about the potential dangers of external links in Excel. 6m
-
1
Sorting Learn to sort data in Excel by a single column or by multiple columns. 4m
-
2
Filtering Learn to filter Excel data for specific words, dates, and apply multiple filters to a single data table. 4m
-
3
Excel Tables Learn about creating Excel tables and their advantages. 6m
-
1
Cell Formatting Learn to work with the Format Cells dialog to apply text rotation and borders, and to center data across multiple cells. 5m
-
2
Building Column Charts Learn how to create an effective column chart by reducing ink and 'noise' that distract from the main messages. 4m
-
3
Building Bar Charts How to create an effective bar chart by reducing ink and noise that distract from the story. 3m
-
4
Building Pie Charts Learn how to build an effective pie chart, and when you should and shouldn’t use them. 4m
-
5
Building Line Charts How to create an effective line chart through careful manipulation of chart elements to enhance its storytelling ability. 5m
-
1
Comments and Notes Learn about creating, reviewing, and printing Excel comments. 5m
Certificate
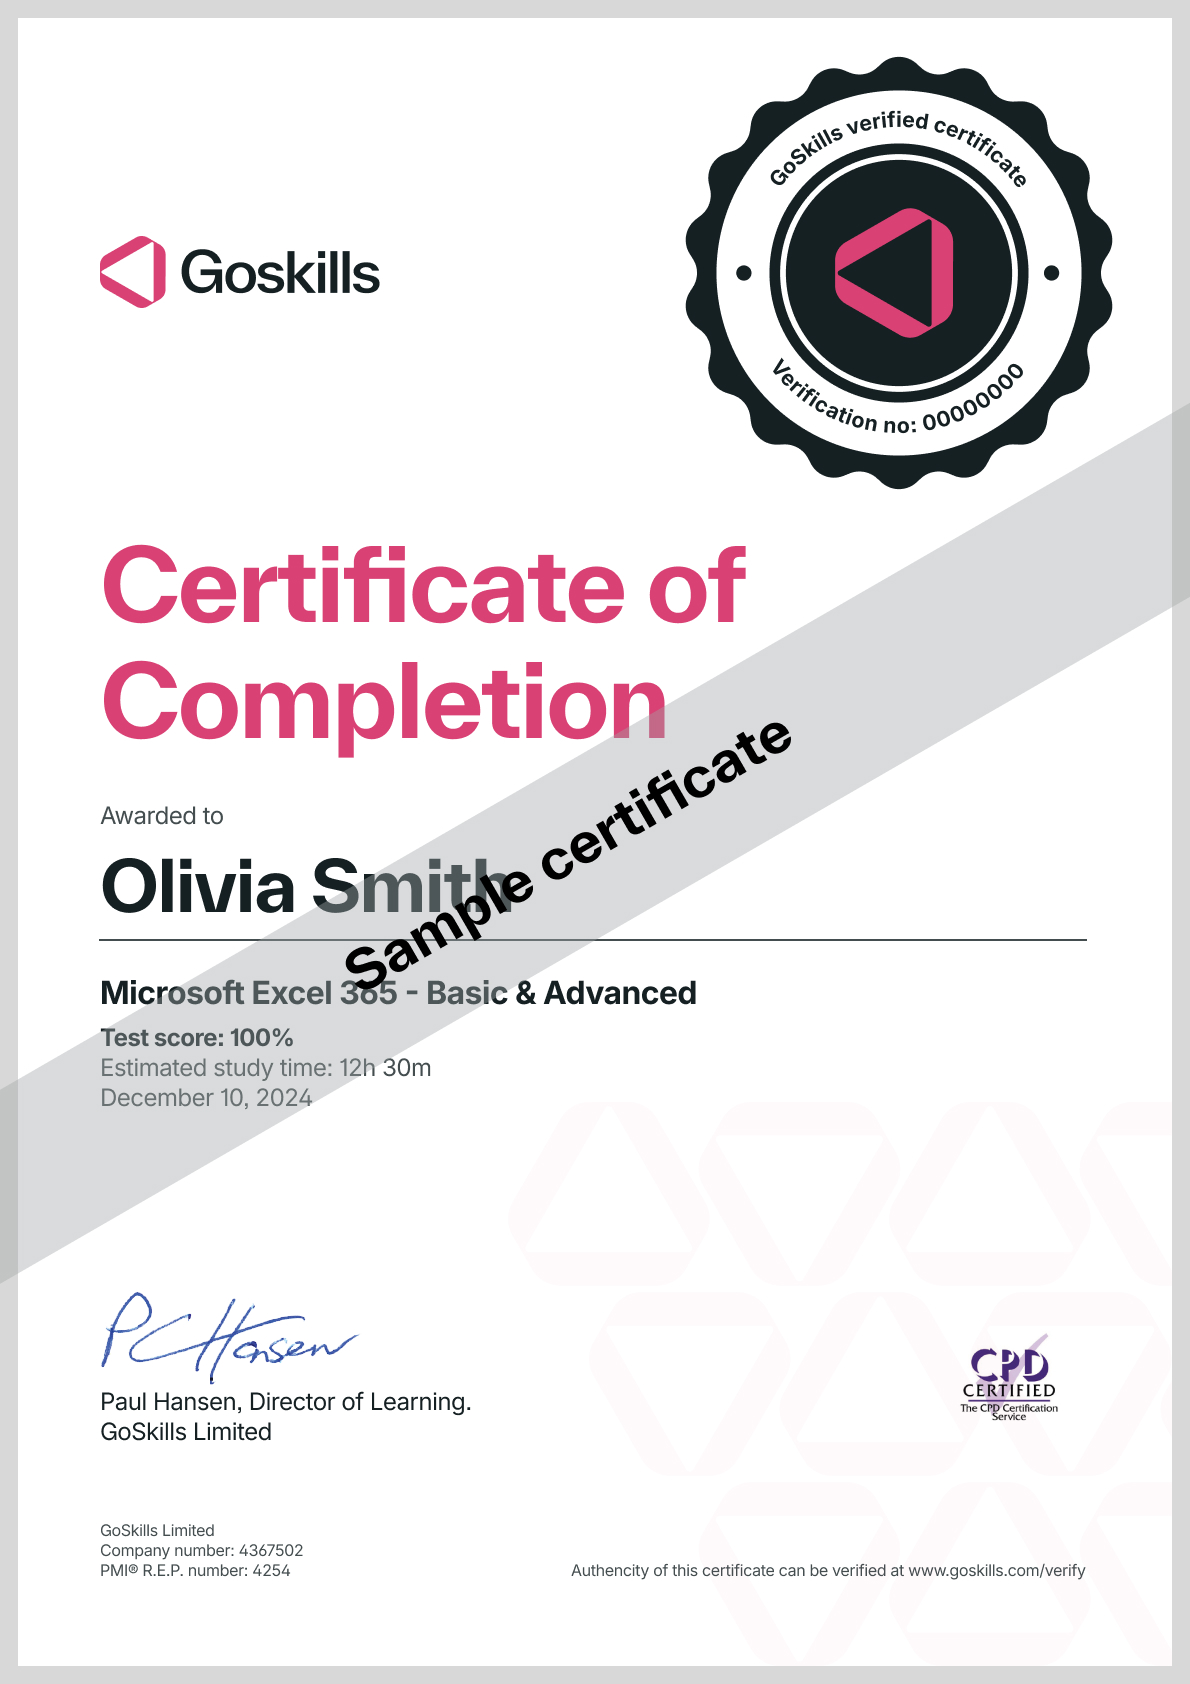
Certificate of Completion
Awarded upon successful completion of the course.

Instructor
Ken Puls
Ken Puls is a globally recognized authority in Microsoft Excel, Power Query, and Power BI, with over two decades of hands-on experience in accounting, IT, and business intelligence systems. His career began in public practice accounting and industry, where he served as both Controller and IT Director, leading numerous system implementations and designing custom business intelligence solutions from the ground up.
Ken’s deep technical expertise is matched by a passion for teaching and community engagement. He has authored several acclaimed books, including RibbonX – Customizing the Office 2007 Ribbon, Power Query Recipes, and Master Your Data with Power Query in Excel and Power BI. His writing reflects a clear, practical approach to solving real-world data challenges.

Ken Puls
Excel MVP
Accreditations
Link to awardsHow GoSkills helped Chris
I got the promotion largely because of the skills I could develop, thanks to the GoSkills courses I took. I set aside at least 30 minutes daily to invest in myself and my professional growth. Seeing how much this has helped me become a more efficient employee is a big motivation.


