Best Introduction to Tableau Course | Learn Tableau for Beginners
Introduction to Tableau
Skills you’ll gain
Tableau introduction: Become a data visualization pro today
Are your presentations and reports unengaging? Do you want to bring your data to life?
Tableau is an industry-leading visualization software that could be the solution to your data woes.
This intro to Tableau course will equip you with the skills you need to become a pro at data visualization.
Through a series of hands-on lessons, this Tableau tutorial helps you to build a foundation in data visualization, giving you the confidence to unlock the true value of your data.
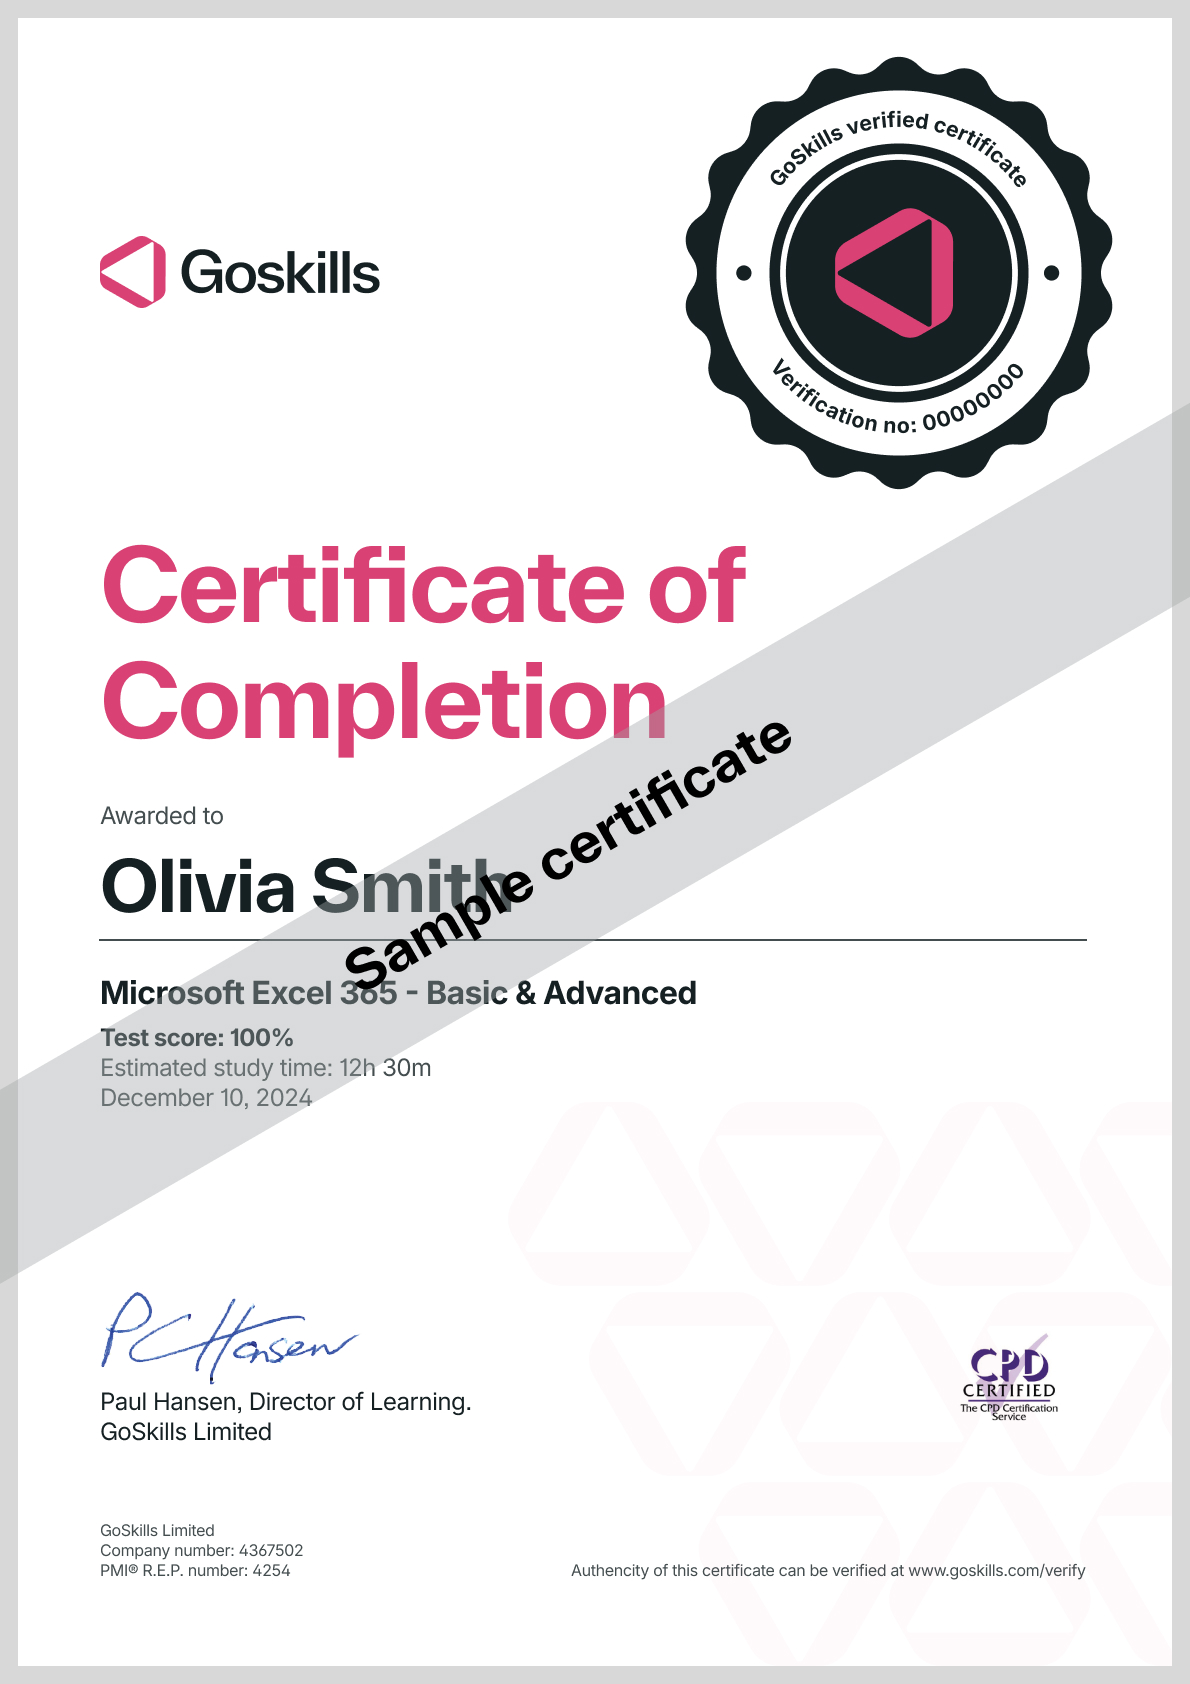
Once completed, you will receive a certificate as evidence of your Tableau training, demonstrating to your employer and colleagues that you have mastered data visualization.
In this course you will learn:
- What Tableau is, and what its applications are
- How to manage data sources
- Ways to create custom calculations and fields
- How to sort and filter data
- How to create basic visualizations
- Ways to format visualizations
- How to create dashboards, and much more.
This course provides Tableau training for beginners. By learning to create and manipulate data visualizations, you will help your organization to make more informed business decisions, and cement your position as an analytics pro.
Are you ready to learn Tableau? Data visualization mastery is just a short course away. And if you want to add more business intelligence tools to your toolbox, then check out our Power BI course.
Once enrolled, our friendly support team and tutors are here to help with any course related inquiries.
Syllabus
Download syllabus-
1
Converting Measures to Dimensions In this lesson, you'll learn how to convert measures to dimensions and dimensions to measures. 3m
-
2
Create Simple Visualization Sheets In this video, you'll learn to create a simple vizualization. 5m
-
3
Resizing Charts and Changing Colors and Headers In this lesson, you'll learn how to resize charts and change basic colors for headers and more. 5m
-
4
Adding Labels To Your Visualizations In this lesson, you'll learn how to add Labels to your Visualizations. 4m
-
5
Adding Percentages In this lesson, you'll learn how to generate and use percentages in our measures count. 3m
-
6
Filtering Data In this lesson, you'll learn about creating filters. 4m
-
7
Using The Filter Card In this lesson, you'll learn how to create a Filter Menu. 3m
-
8
Using The Pages Card In this lesson, you'll learn about the Pages Card on the Worksheet screen. 4m
-
9
Changing Mark Types (Dots, Lines, Bars, etc.) In this lesson, we'll look at the Mark Card to change Mark types. 4m
-
10
Using Size Marks In this lesson, you'll learn how to change the size marks on your Visualizations. 2m
-
11
Using Tool Tips In this lesson, you'll learn about tool tips and how to add more detail. 3m
-
1
Adding Secondary Categories To Your Visualizations In this lesson, you'll learn how to add multiple Dimensions to your Visualizations. 3m
-
2
Adding Multiple Fields Using 'Show Me' In this lesson, you'll learn how to create Visualizations with Multiple fields using the "Show Me" Tab. 3m
-
3
Creating Custom Measures In this lesson, you'll learn how to create custom measures for your Visualizations. 5m
-
4
Using Zipcodes With Maps In this lesson, we'll learn all about using Zipcodes with your Visualizations. 3m
-
5
Adding Dates and Drilling Down By Date In this lesson, you'll learn how to drill down by date in your Visualization. 4m
-
6
Using Animations in Vizualizations In this lesson, we'll add animations to our Visualizations. 4m
-
7
Duplicating Worksheets In this lesson, you'll learn how to duplicate worksheets. 3m
-
1
Publishing Your Visualization to Tableau Public In this lesson, you'll learn about saving your Visualizations on the Tableau cloud. 5m
-
2
Sharing Your Visualization As A PowerPoint File In this lesson, you'll learn how to share your Visualization as a PowerPoint, PDF, and Image file. 4m
-
1
Creating A First Dashboard and Resizing It In this lesson, you'll learn how to create a Dashboard and resize it. 4m
-
2
Adding Sheets To Dashboard and Positioning Them In this lesson, you'll learn how to add Worksheets to your Dashboard and position them. 4m
-
3
Predefining a Dashboard In this lesson, you'll learn how to predefine the layout of a dashboard. 5m
-
4
Fitting To Width In this lesson, you'll learn how to apply "Fit To Width" to Worksheets on a Dashboard. 3m
-
5
Changing Font Sizes and Colors In The Dashboard In this lesson, you'll learn how to change the font sizes and colors for Title text in the Dashboard. 3m
-
6
Rearranging the Vertical Column In this lesson, you'll learn how to rearrange the far right vertical column on the Dashboard. 4m
-
7
Adding Images and Text In this lesson, you'll learn how to add Images and Text to your Dashboard. 3m
-
8
Using Floating Tiles In this lesson, you'll learn how to use floating tiles. 4m
-
9
Adding Web Pages To Dashboards In this lesson, you'll learn how to add a webpage to a Dashboard. 3m
-
10
Adding Blank Space - How And Why In this lesson, you'll learn how and why to add blank space to your Dashboard. 3m
-
11
Creating Stories In this lesson, you'll learn how to create stories. 4m
-
12
Opening Saved Files In this lesson, you'll learn how to open a saved Tableau file. 3m
-
13
Conclusion Congratulations! You've made it to the end of the course! 1m
Certificate
Certificate of Completion
Awarded upon successful completion of the course.

Instructor
John Elder
John founded one of the Internet's earliest advertising networks (bannerclicks.com) and sold it at the height of the first dot com boom. John went on to develop the award-winning Submission-Spider search engine submission software that's been used by over 3 million individuals, businesses, and governments in over 42 countries.
John has over 20 years experience in web development, building professional websites across all platforms. John's passion for learning new technologies lead him to master both front end and back end work, making him a sought after full-stack developer.

John Elder
Web Developer and Author
Accreditations
Link to awardsHow GoSkills helped Chris
I got the promotion largely because of the skills I could develop, thanks to the GoSkills courses I took. I set aside at least 30 minutes daily to invest in myself and my professional growth. Seeing how much this has helped me become a more efficient employee is a big motivation.


