Microsoft Excel for Mac - Basic
Microsoft Excel for Mac - Basic
Skills you’ll gain
New to Excel or need a refresher? This online course is designed to give you a solid foundation in the basics of Excel for Mac. Supports Excel for Mac 2016. Also available: Excel Basic (PC).
In 24 engaging lessons you will learn how to use math, statistical, logic and text functions, organize data by sorting and filtering, effectively present your data in several chart formats and more.
Whether you use Excel for work or study, these tutorials will start you on your journey to becoming an Excel Ninja! Learn more about how a GoSkills Excel certification can boost your career.
Video tutorials are recorded in Microsoft Excel for Mac 2016.
Want to be a more efficient Excel user? Start learning 200 of the best Excel shortcuts for PC and Mac.
Once enrolled, our friendly support team and tutors are here to help with any course related inquiries.
Syllabus
Download syllabus-
1
Formula Anatomy Understanding Excel Formula Anatomy. 7m
-
2
Cell Referencing Learn about working with absolute and relative cell referencing, and techniques for copying formulas. 5m
-
3
Function Anatomy Use to understand the anatomy of Excel functions, and what their components mean. 7m
-
4
Math Functions Learn basic math functions including SUM, ROUND and SUBTOTAL. 5m
-
5
Basic Statistics Learn basic statistical functions including COUNT, COUNTA, AVERAGE, MAX, MIN, MEDIAN and MODE. 5m
-
6
Logic Functions Learn to build standalone logical IF functions, and make them more complex by nesting AND and OR within them. 5m
-
7
Text Functions Learn to break apart text with the LEFT, RIGHT, MID, FIND and SEARCH functions, and to combine text with the & character. 6m
-
1
Conditional Math Learn to use SUMIF, COUNTIF and SUMPRODUCT to add cells only when certain conditions are met. 6m
-
2
External Links Learn about creating and updating external links, and about the potential dangers of external links in Excel. 5m
-
1
Sorting Learn to sort data in Excel by a single column or by multiple columns. 3m
-
2
Filtering Learn to filter Excel data for specific words, dates, and apply multiple filters to a single data table. 5m
-
3
Contiguous Data Learn tricks for consolidating your data so it's vertically contiguous (without blank rows) – for Tables, PivotTables and Charts. 5m
-
1
Cell Formatting Learn to work with the Format Cells dialog to apply text rotation and borders, and to center data across multiple cells. 6m
-
2
Building Column Charts Learn how to create an effective column chart by reducing ink and 'noise' that distract from the main messages. 4m
-
3
Building Bar Charts How to create an effective bar chart by reducing ink and noise that distract from the story. 5m
-
4
Building Pie Charts Learn how to build an effective pie chart, and when you should and shouldn’t use them. 5m
-
5
Building Line Charts How to create an effective line chart through careful manipulation of chart elements to enhance its story telling ability. 4m
-
1
Comments Learn about creating, reviewing and printing Excel comments. 4m
Certificate
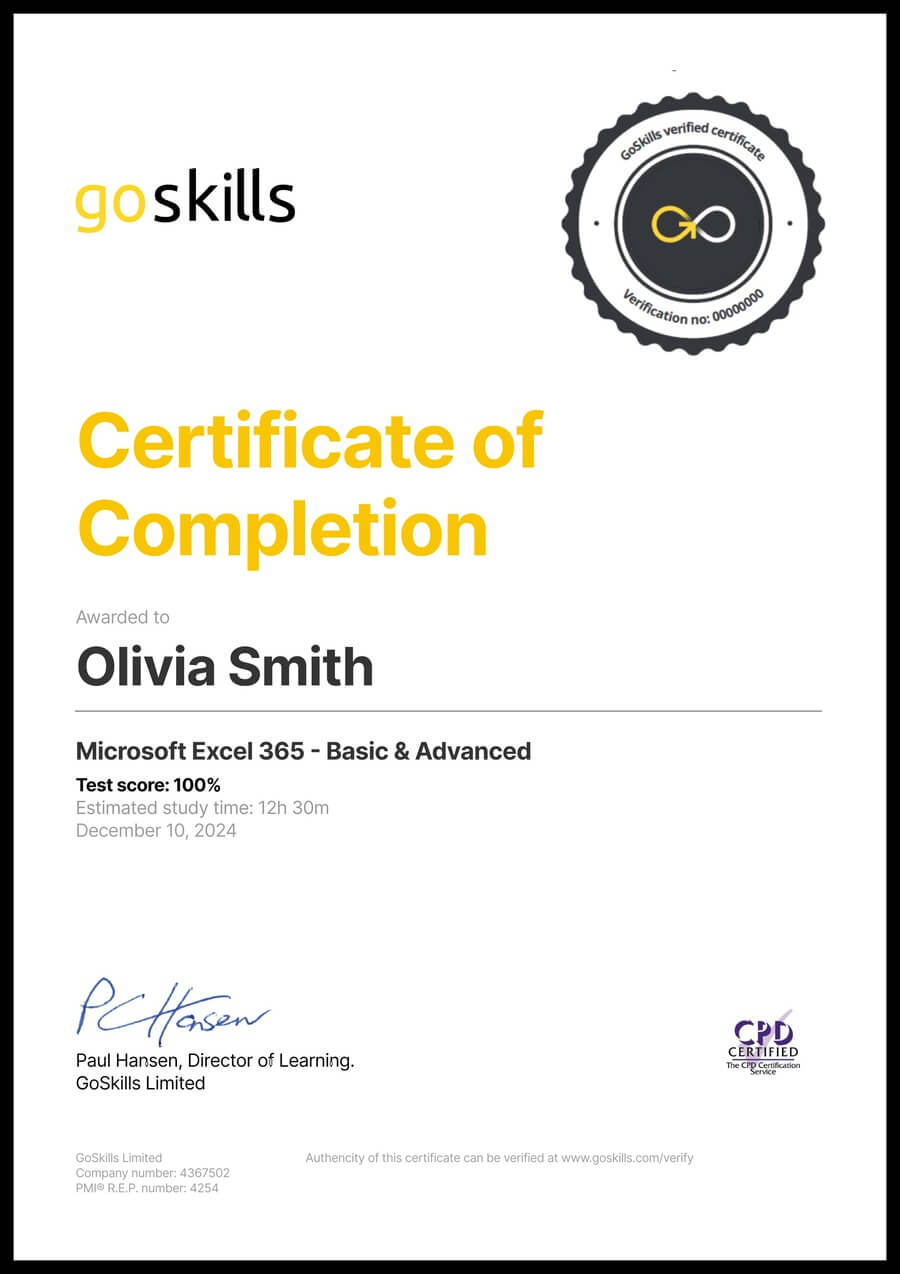
Certificate of Completion
Awarded upon successful completion of the course.

Instructor
Ken Puls
Ken Puls is a globally recognized authority in Microsoft Excel, Power Query, and Power BI, with over two decades of hands-on experience in accounting, IT, and business intelligence systems. His career began in public practice accounting and industry, where he served as both Controller and IT Director, leading numerous system implementations and designing custom business intelligence solutions from the ground up.
Ken’s deep technical expertise is matched by a passion for teaching and community engagement. He has authored several acclaimed books, including RibbonX – Customizing the Office 2007 Ribbon, Power Query Recipes, and Master Your Data with Power Query in Excel and Power BI. His writing reflects a clear, practical approach to solving real-world data challenges.

Ken Puls
Excel MVP
Accreditations
Link to awardsHow GoSkills helped Chris
I got the promotion largely because of the skills I could develop, thanks to the GoSkills courses I took. I set aside at least 30 minutes daily to invest in myself and my professional growth. Seeing how much this has helped me become a more efficient employee is a big motivation.


