
Can you effectively analyze sales and product performance using Excel PivotTables? This challenge focuses on using PivotTables to organize, summarize, and derive insights from sales data.
Everything you need to participate is available on this page. To get started:
- Download the Excel worksheet containing the data and the solution.
- Open the file and navigate through the "Ratios" and "Totals" sheets.
- Review the scenario and complete the assigned tasks marked in oval shapes near each PivotTable.
Download the file to get started!
Solve this data analysis challenge by using PivotTables
The challenge
Scenario
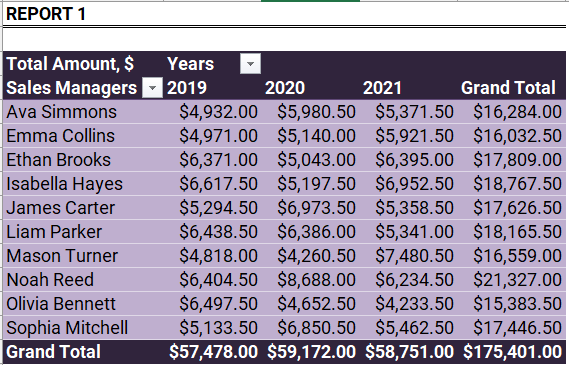
You work as a business analyst at ExcelWorld Co. Your manager has asked you to deliver a detailed analysis of sales managers' and products' performance over multiple years. The analysis should provide clear breakdowns, comparisons, and rankings to help the executive team make informed decisions.
Tasks
Build the following set of analyses in Excel:
- Calculate the share of each manager’s sales for each year in relation to their total sales.
- Rank sales managers by their annual sales amounts, assigning the highest sales to the top (1st) position.
- Analyze the order amounts for each product across years by calculating both absolute ($) and relative (%) differences.
- Compute cumulative sales amounts and their percentage contributions year by year.
You are expected to:
- Create and manipulate PivotTables to generate the required outputs.
- Copy and adapt PivotTables as necessary, such as renaming the duplicated PivotTable as "Report 2."
- Calculate ratios, differences, and cumulative metrics directly from PivotTable data where possible.
Some clues
Don't know much about PivotTables, or need a quick refresher? We've got you covered. Check out these handy resources to upgrade or sharpen your skills:
- Advanced PivotTable Techniques
- Ultimate Guide to PivotTables in Excel
- How to Create a PivotTable in 5 Easy Steps
What will you learn?
This practical challenge will help you master:
✅ Building and customizing PivotTables.
✅ Performing year-over-year and cumulative analyses.
✅ Using absolute and relative comparisons.
✅ Structuring your findings to support business reporting and decision-making.
Download the file to get started!
Solve this data analysis challenge by using PivotTables
Sharpen your Excel skills with this real-world PivotTable analysis scenario!
The solution💡
Ready to check out the GoSkills solution to this challenge?
Did you do it the same way, or would you like to share a different approach? Have your say in our Excel Slack community!
We hope you enjoyed taking part in this challenge. Stay tuned to the GoSkills Excel Resource hub for more Excel challenges, and check out our range of expert-led Excel courses for all skill levels to further sharpen your skills.
We recommend Excel for Business Analysts by Microsoft MVP Deb Ashby. Learn how to clean, analyze, and share data in Excel like a pro. Try the course for free!

Join the Excel conversation on Slack
Ask a question or join the conversation regarding Excel challenges on our Slack channel.
Join Slack channel