Learn Excel Online
Learn Excel Online
The single most comprehensive online Excel resource for beginners.
Trusted by more than 10,000 teams worldwide
Start for freeNo matter where you are on your Excel journey, these free resources are here to support you.
Use them as a warm-up before diving into our Excel training courses, or revisit them anytime to reinforce your skills and build confidence.
Start with the essentials — like formulas, functions, filtering, and formatting — then gradually work your way up to more advanced tools like Macros and Power Pivot.
We’ve also included 50+ curated resources to help you continue learning Excel online at your own pace.
Before exploring advanced data analysis tools, it’s important to establish a strong foundation.
This section will help you become familiar with Excel’s interface and core features so you can progress with confidence.
Learn Excel Basics
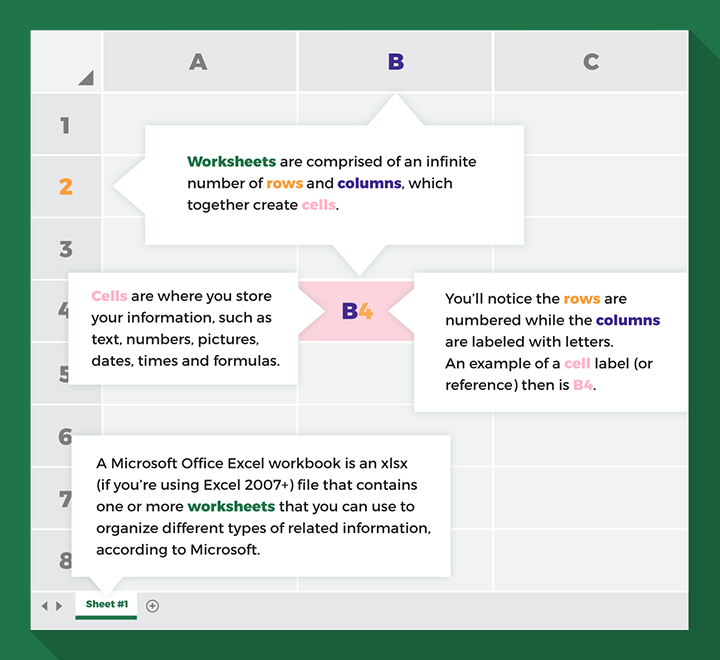
A Microsoft Excel workbook is an xlsx (if you’re using Excel 2007+) file that contains one or more worksheets used to organize related information.
Worksheets consist of a nearly infinite number of rows and columns, which intersect to create cells.
Cells are where you store information such as text, numbers, pictures, dates, times, and formulas.
Rows are numbered, and columns are labeled with letters. Each cell therefore has a unique reference, such as A2 or H5.
Basics of Excel: The Ribbon
To work efficiently in Microsoft Excel, you need to understand the Ribbon.
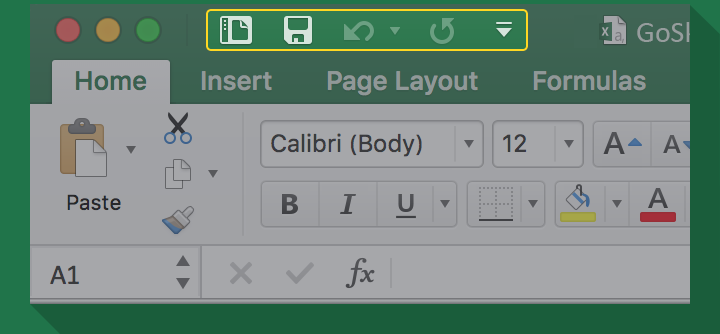
What is the Quick Access Toolbar?
Excel’s Quick Access Toolbar gives you one-click access to the commands you use most often.
You can customize what appears here by clicking the arrow icon in the top-left corner of the window and selecting the commands you want to add.
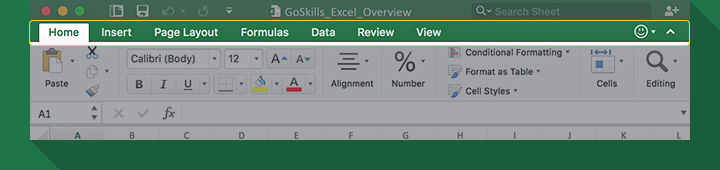
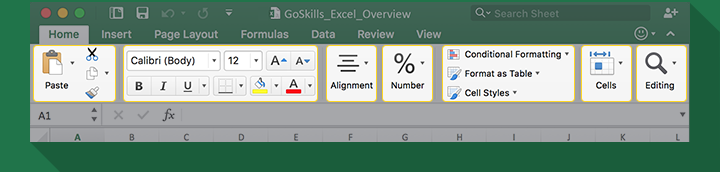
What is the Ribbon?
The Ribbon is a collection of tabs at the top of your workbook that help you perform specific actions. Think of it as a hierarchy:
- Tabs (Home, Insert, Page Layout)
- Groups (Clipboard, Font, Alignment)
- Commands (Copy, Paste, Sort, Filter)
Each tab contains groups of related commands, and each group includes buttons and controls.
Let’s take a closer look at how this works.
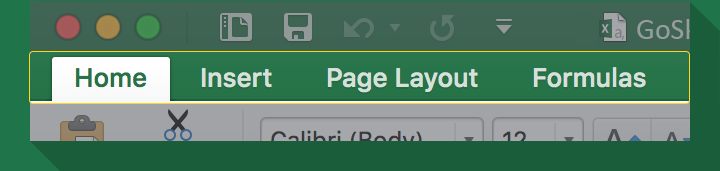
What are Tabs?
The Ribbon is divided into clickable tabs that organize commands into logical categories.
Your Excel Ribbon may look slightly different from someone else’s. This can happen for several reasons:
1. Add-ins
Add-ins extend Excel’s capabilities and often add new tabs to the Ribbon.
2. Contextual Tabs
Contextual tabs appear automatically when you select certain objects, such as charts or tables. These tabs contain commands related specifically to the selected object.
3. Customization
You can customize the Ribbon by adding or removing tabs to better suit your workflow.
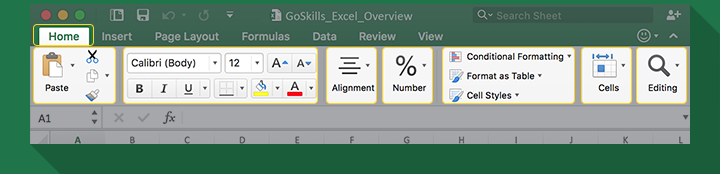
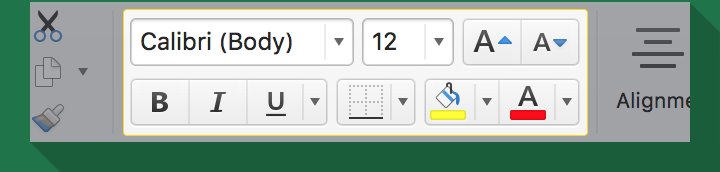
What are Command Groups?
Command groups are collections of related buttons and controls within each tab.
Depending on which tab you select — Home, Insert, Page Layout, and so on — different command groups will appear below.
What can you do with Excel?
Excel is a powerful and versatile program that allows you to organize, analyze, present, and even automate your data.
Using spreadsheets typically follows a three-step process:
Enter data
Do something with
the data
Interpret the results
Occasionally, there’s a fourth step:
Automate the process
Do something with data
Before analyzing your data, it helps to format your spreadsheet so it’s easier to read and navigate. Here are a few essential skills to know.
How to apply conditional formatting
Formatting improves readability, but conditional formatting takes it a step further by automatically styling cells based on their values.
For example, imagine you have a spreadsheet listing distilleries and the dates they were founded. If you want to identify the oldest three distilleries, you can use conditional formatting to highlight them automatically.
Keep in mind that conditional formatting applies to every selected cell, so be careful when selecting ranges to avoid unintended formatting.
How to use freeze panes
There’s nothing more frustrating than scrolling through a large spreadsheet and losing sight of your column headers.
Excel’s Freeze Panes feature allows you to keep specific rows or columns visible while scrolling.
To freeze column headers:
- Click the row directly beneath your headers.
- Go to the View tab.
- Click Freeze Panes and choose Freeze Panes from the dropdown.
Now, when you scroll, your headers will remain visible.
What are formulas & functions?
One of the main reasons Excel is widely used in business is its ability to perform calculations and power data analysis.
To do that effectively, you need to understand formulas and functions.
Formulas are the simplest way to perform calculations in Excel. Every formula begins with an equals sign (=).
Every formula begins with an equals sign.
Start formulas with "="
 Use "+" for addition.
Add numbers
 Use "-" for subtraction.
Subtract numbers
 Use "*" for multiplication.
Multiply numbers
 Use "/" for division.
Divide numbers
While you can manually enter numbers into a formula, it’s better practice to use cell references. This allows you to copy the formula across multiple cells without hard-coding values.
Functions are predefined formulas that perform specific calculations. They’re organized by category and designed to simplify complex tasks.
Some of the most commonly used functions include:
Interpret your data
Now that you’ve gathered your data, the next step is to interpret it.
Raw data can be difficult to understand — especially when it’s messy or unorganized. That’s why visualizing and organizing your data is so important.
A clean, structured layout makes patterns easier to spot and insights easier to extract.
Below are a few simple ways to organize and present your data more clearly.
How do you sort data by column?
Sorting your data by column (or category) is one of the quickest ways to make it easier to read and analyze. Here’s how to do it.
Prepare your data for sorting
Before sorting, make sure your data is properly structured. Your data is ready to sort if:
- It’s arranged in a clear tabular format (rows and columns).
- There are no blank rows or columns interrupting the dataset.
- You have a distinct header row that labels each column (optional, but strongly recommended).
Once your data meets these criteria, you’re ready to sort.
How to perform a single-level sort
- Select any cell within your data table (or highlight the entire range you want to sort).
- Go to Data > Sort.
- Choose the column you want to sort by and select your preferred order (for example, A–Z or Z–A).
- Click OK.
Your data will now be sorted based on that single column.
How to perform a multi-level sort
Multi-level sorting is especially useful for larger datasets. It allows you to sort by one column first, then further organize matching values (ties) using additional columns.
- Select any cell within your data table (or highlight the entire range you want to sort).
- Go to Data > Sort.
- Set up your primary sort (the first column you want to sort by).
- Click Add Level.
- Choose your secondary sort to organize any tied values.
- Repeat this process to add additional levels as needed.
You can add as many sorting levels as necessary to fully organize your data.
How to use filtering
Filtering helps you drill down into your data and display only the records that are relevant to what you’re analyzing.
Prepare your data for filtering
Before applying filters, make sure your data:
- Is organized in a tabular format (rows and columns).
- Has no blank rows or columns interrupting the dataset.
- Includes a distinct header row (optional, but highly recommended).
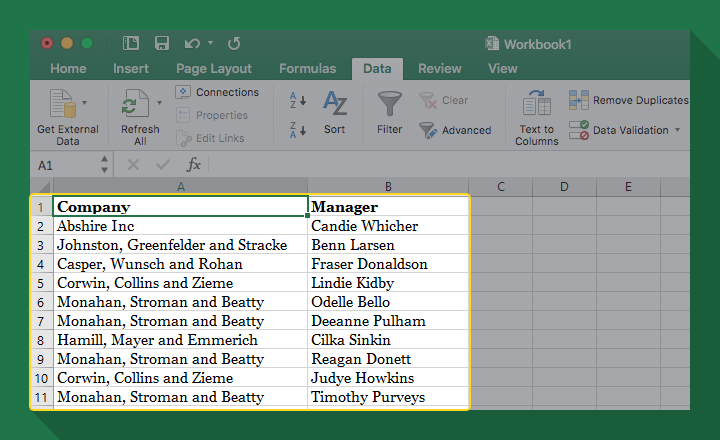
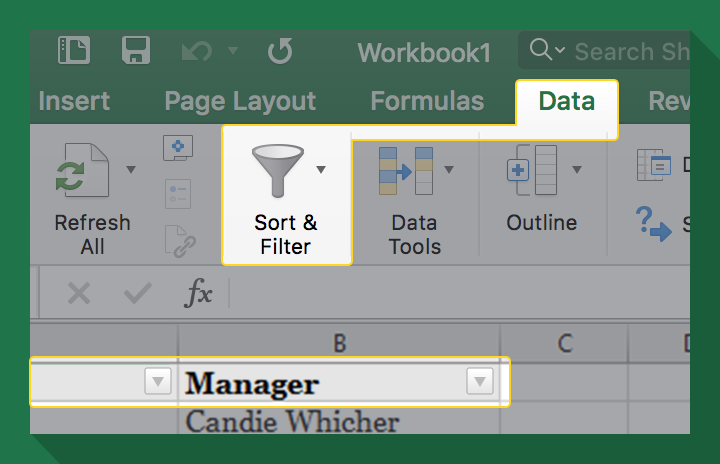
To apply a filter:
- Select the header row of your dataset.
- Go to the Data tab.
- Click Filter.
- Drop-down arrows will appear in each header cell.
Filter for specific words
- Click the drop-down arrow in the column you want to filter.
- Use the Search box to type the word or term you’re looking for.
- Click OK.
Filter for specific dates
- Click the drop-down arrow in the date column.
- Uncheck Select All to clear the list.
- Use the checkboxes to select the specific dates (or date ranges) you want to view.
If you’re using Excel 365 or Excel 2021 and beyond, you can use the FILTER function to perform these filter operations and more.
What is a PivotTable?
A PivotTable lets you reorganize and summarize your data in different ways — almost like rotating a Rubik’s Cube to see new patterns and insights.
How to create a PivotTable
- Select any cell within your data range.
- Go to the Insert tab and choose PivotTable.
- Choose to place the PivotTable on a new worksheet.
- Drag a numeric field into the Values area.
- Drag text fields into the Rows area (and/or Columns, if desired).
How to remove fields from a PivotTable
- To remove a field, drag it out of the layout area and back into the field list.
How to modify a PivotTable
- Drag a field from Rows to Columns (or vice versa) to change the layout.
- Click the arrow beside a field in the Values area, choose Value Field Settings, and select a different calculation (such as Average instead of Sum).
- If you update your source data, return to the original dataset and make your changes.
- Go back to the PivotTable.
- Right-click inside the PivotTable and select Refresh.
For more in-depth PivotTable tutorials, see the resources section below.
How do you automate data in Excel?
If you perform the same tasks repeatedly, you can automate them using Macros.
What is a Macro?
A macro is a recorded sequence of actions that you can replay at any time. Instead of repeating the same manual steps, you can run a macro to complete the task instantly — saving time and reducing errors.
How to record a Macro
Add the Developer tab (if needed)
- Right-click anywhere on the Ribbon and select Customize Ribbon.
- In the list on the right, check the box next to Developer.
- Click OK to activate the Developer tab.
Prepare to record
- Practice the steps beforehand — the macro recorder captures every action, including mistakes.
- Remember: a macro will repeat the exact same steps each time it runs (unless you modify it using VBA).
Record the Macro
- Go to the Developer tab and click Record Macro.
- Enter a name (no spaces).
- (Optional) Assign a shortcut key using a capital letter (for example, Shift + R).
- Choose to store the macro in This Workbook.
- Perform the actions you want to automate.
- Click Stop Recording on the Developer tab.
How to run a Macro
You can run your macro in three ways:
- Press Ctrl + Shift + [Your Shortcut Key].
- Press Alt + F8, select the macro, and click Run.
- Insert a Form Control Button from the Developer tab and assign the macro to it. Then click the button to run it.
For more Macros and VBA tutorials, check out our resources section below.
50+ free resources to learn Excel online
To help you keep building your skills, we’ve compiled 50+ free Excel resources, including step-by-step tutorials, essential keyboard shortcuts, and ready-to-use templates designed to save you time.
Want something more in-depth? You’ll also find online courses designed to help you build and apply your skills, fast.
Templates, shortcuts, and add-ins
Use these beginner-friendly Excel templates, shortcuts, and add-ins to work smarter and save yourself valuable time.
- 200 Best Excel Shortcuts for PC and Mac
- 50 Best Excel Add-Ins That Will Make Your Life Easier
- 50+ Free Excel Templates to Make Your Life Easier
- 30+ Excel Business Templates for Workplace Productivity
- Excel Gantt Chart Template
- Excel Tax Tracker Template
Beginner tutorials
Make use of these Excel tutorials for beginners or those needing a refresher on the essentials.
Video tutorials
Resources
- 6 Things You Should Absolutely Know How to Do in Excel
- Best Excel Tips for Beginners
- Excel Hacks You Need to Know Now
- Best Excel Presentation Tips
- How to Master Excel in 11 Steps
Courses
- Excel - Basic (PC)
- Excel - Basic & Advanced (PC)
- Excel - Basic (Mac)
- Excel - Basic & Advanced (Mac)
- Excel for Marketers
Intermediate/Advanced tutorials
Once you’ve mastered the basics, try your hand at learning these intermediate and advanced skills.
Video tutorials
Resources
- The Ultimate Guide to Excel Charts
- Why You Should Be Using INDEX MATCH instead of VLOOKUP
- 9 Best Excel Skills for Accountants in 2020
- How (and When) to Use ANOVA in Excel
Courses
- Excel - Advanced (PC)
- Excel - Advanced (Mac)
- Financial Modeling Basics in Excel
- Financial Modeling Techniques in Excel
For more intermediate and advanced resources, see the sections below, organized into specific categories.
Pivot Tables tutorials
Learn how to use one of Excel’s most indispensable tools, the Pivot Table, to analyze and present your data in an understandable way.
Video tutorials
Resources
Courses
Macros and VBA tutorials
Learn how to automate your most repetitive tasks by creating powerful macros with VBA.
Video tutorials
Resources
- The Beginner’s Guide to Excel Macros
- Excel VBA - Advanced Filtering Tutorial
- Excel User Defined Functions Examples
Courses
Data visualization tutorials
Learn data visualization skills to design and build dynamic and beautiful Excel dashboards.
Video tutorials
- 3 Key Data Visualization Principles
- Master Bar and Column Charts in Excel 365
- Comparing Data With Pie and Donut Charts
Resources
Courses
Power Query tutorials
Learn how to use Power Query, a business intelligence tool within Excel that allows you to extract, clean, and reshape your data to prepare it for analysis.
Video tutorial
Resources
Courses
Power Pivot tutorials
Learn how to use Power Pivot, a business intelligence tool within Excel that allows you to transform large data sets into supercharged tables for data analysis and modeling.
Video tutorial
Resources
Courses
Power BI tutorials
More advanced Excel users who are working with tools like Power Query and Power Pivot to clean and analyze their data may also be interested in Power BI. You can import data from your Excel files into Power BI to build beautiful and interactive reports and dashboards.
Video tutorial
Resources
Courses
We hope these resources help you in your quest to learn Excel online. Check out our complete resources section and sign up for our newsletter to get notified of our latest articles and tutorials.
FAQs
Frequently asked questions about GoSkills Excel courses.
What makes GoSkills Excel courses the best online Excel courses available?
With over 13 years of experience, GoSkills courses are created by Excel experts and taught by industry leaders like Microsoft MVP Ken Puls. Each course is designed to be engaging, practical, and easy to follow, with bite-sized lessons that help you learn efficiently — whether you’ve got 5 minutes or an hour to spare.
Are these Excel courses suitable for beginners as well as advanced users?
Yes! Our Excel library covers the full spectrum, from foundational skills like formulas and formatting to advanced topics like macros, VBA, and data analytics. Whether you’re brand new to Excel or looking to deepen your expertise, there’s a course tailored to your level.