
Understanding the difference between the various Power BI tools can be very confusing for beginners.
What is the difference between Power Query vs Power Pivot? Or between Power Pivot vs Power BI? And when would you use one over the other?
In this article we will break down the different power tools individually, explain their roles and then understand how they can all work together.
Step up your Excel game
Download your cheatsheet of the best Excel shortcuts for PC and Mac
What is Power Query?
Power Query is the tool used to import, clean and shape data in Excel.
If you've never heard of Power Query and want to get familiar with what it can do, then check out this quick intro video:
It first appeared in Excel 2013 but was made available only as an add-in named Power Query. From Excel 2016 and in Microsoft 365, it is available directly within Excel from the Data tab, but is labeled Get & Transform.
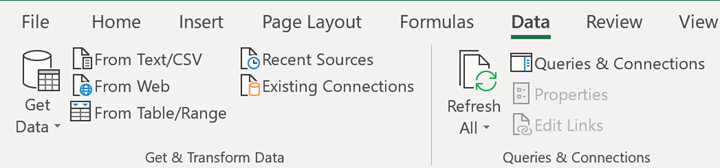 Power Query can import data from a variety of sources including CSV, text files, a folder on a drive, Facebook and Salesforce. New connections are being built into Power Query regularly making it easy to get data from external sources.
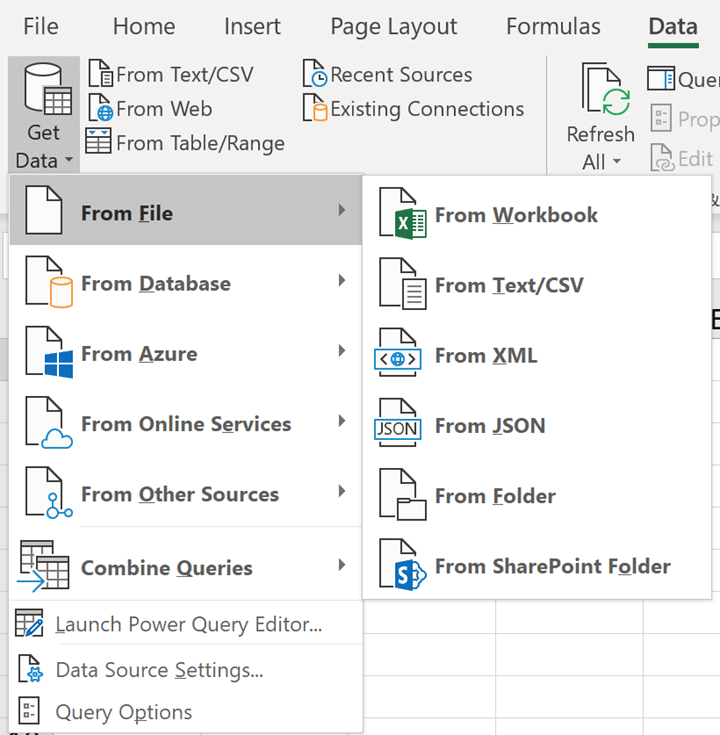 After importing data (connecting to a source) the Power Query Editor window opens.
This tool is extremely powerful, incredibly useful - but yet simple to use. It has a nice easy to use interface with a variety of commands that will be recognizable to many Excel users.
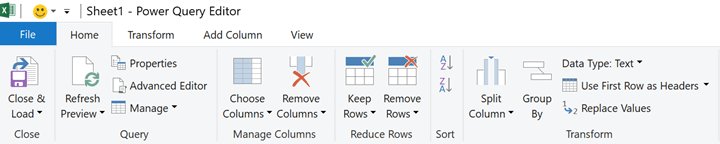 As users perform commands to clean and shape their data such as split columns, replace values or remove duplicates - Power Query records the step and writes M code behind the scenes (similar to how VBA is written when you record a macro).
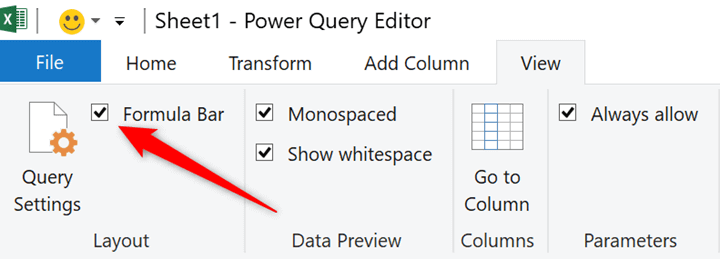
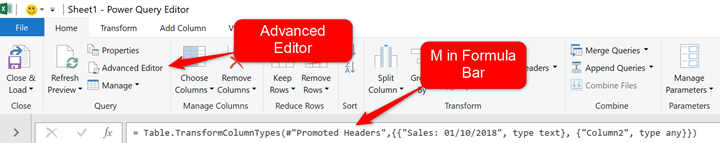
M is the language of Power Query. It is quite different to Excel formulas and tricky to master. Power Query shields you from the code by hiding the Formula Bar. But you can click View > Formula Bar to show it in the Power Query Editor.
 Advanced users can manipulate this code by using the Advanced Editor on the Home tab, or directly in the Formula Bar.
 The steps that a user has performed are recorded and shown in the Applied Steps pane.
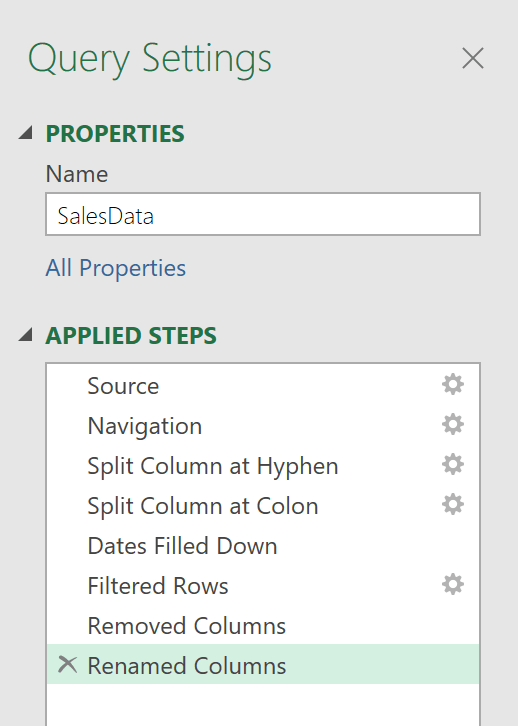 A user can view, edit and delete the steps from here. Power Query does not have an undo button. Removing a step is the undo of Power Query.
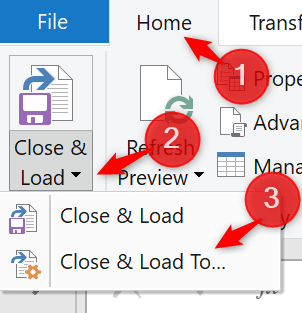
All of these steps are saved in the query. The query can then be loaded ready for analysis by clicking Home, the list arrow on the Close & Load button and then Close & Load To.
 You can load your data into a table in Excel, straight into a PivotTable or just as a connection.
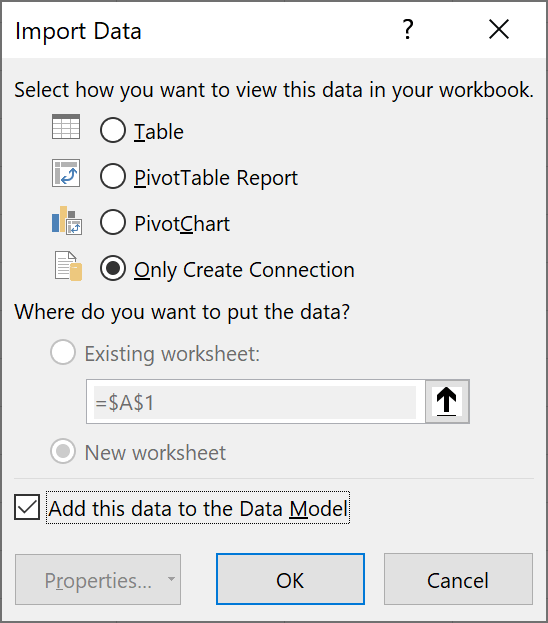 Loading it directly into a PivotTable enables us to avoid the physical limitations and strain on Excel. You can avoid monstrous file sizes because you are not actually storing the data in Excel.
By loading as a connection you can load much larger datasets than what Excel can handle (over 1 million rows of data), still keep your file sizes lean by not storing them in Excel and take advantage of more advanced calculations by using Power Pivot (our next Power tool to discuss).
Queries can be run again in the future by clicking the Refresh button on the Data tab, or using the Queries and Connections pane in Excel.
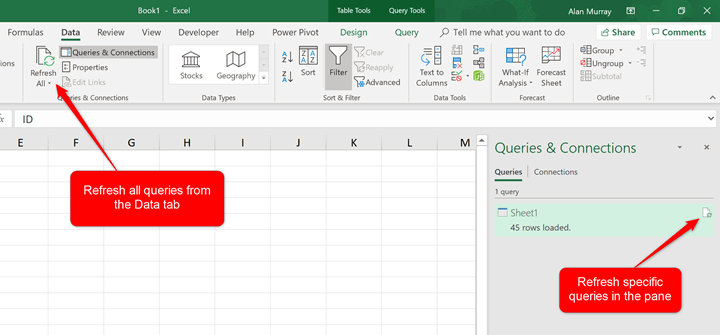 Imagine the potential here for regular data imports and reports that you may create. The whole process could be reduced to the click of the refresh button.
For more on this powerful tool, check out our rundown of the best Power Query tips.
Step up your Excel game
Download your cheatsheet of the best Excel shortcuts for PC and Mac
And test your Power Query skills with this Excel data analysis challenge.
What is Power Pivot?
Power Pivot is used to model your data and perform more complex calculations than Excel can handle.
Power Pivot is great when working with huge data sets. Once Power Query has imported and cleaned the various data sources, Power Pivot is used to establish relationships between the tables/queries.
Then using DAX (Data Analysis Expressions), the formula language of Power Pivot, you can create more powerful calculations and more sophisticated data models than you can in Excel alone.
You should check out the definitive guide to using Power Pivot for more detail than this article will go into.
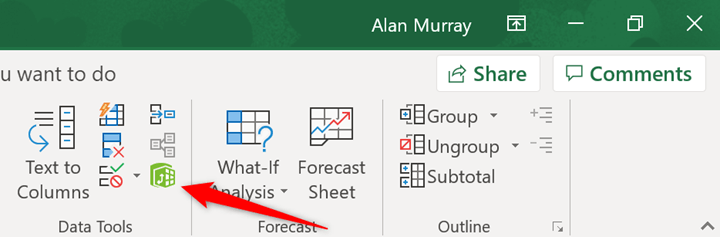
Power Pivot was initially only available as an add-in, but from Excel 2013 has been part of native Excel. You can access Power Pivot by clicking the Go to the Power Pivot Window button on the Data tab.
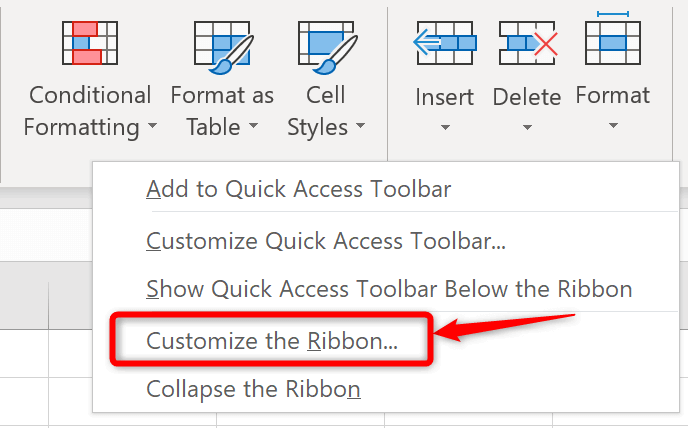
 Alternatively, you can enable the Power Pivot tab on the Ribbon. This is hidden by default.
Right mouse click anywhere on the Ribbon and click Customize the Ribbon.
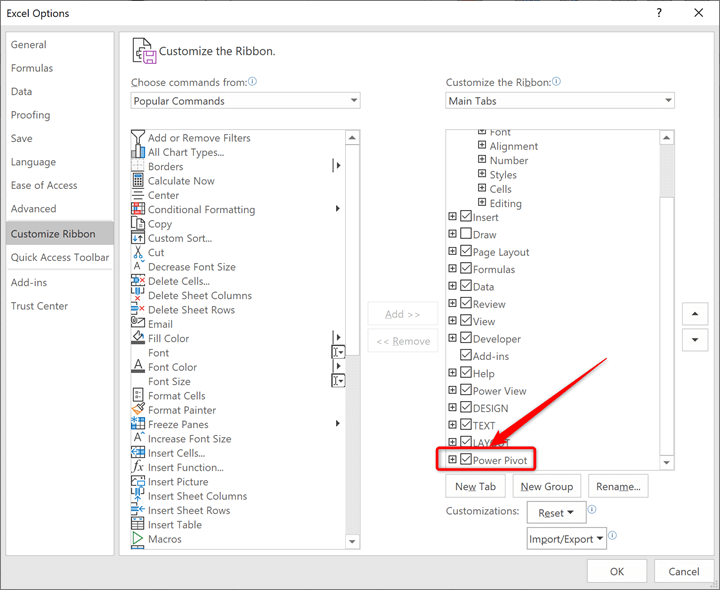
 Check the box for Power Pivot on the right and click Ok.
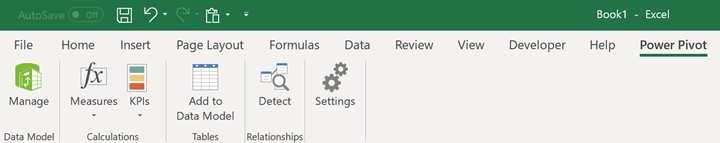
 The Power Pivot tab is shown below. It has a button to open the Power Pivot window (just like the Data tab), to create measures (DAX formula) directly in Excel and a few more.
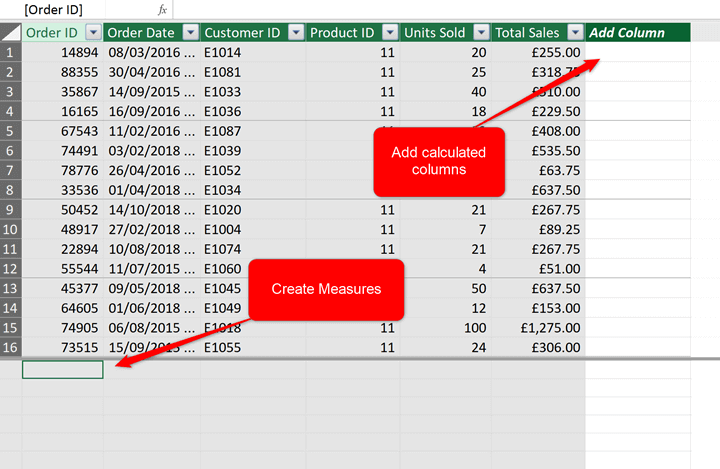
 The Power Pivot window has two views. The Data view looks similar to Excel and enables you to see your data and create calculated columns and measures using DAX formulas.
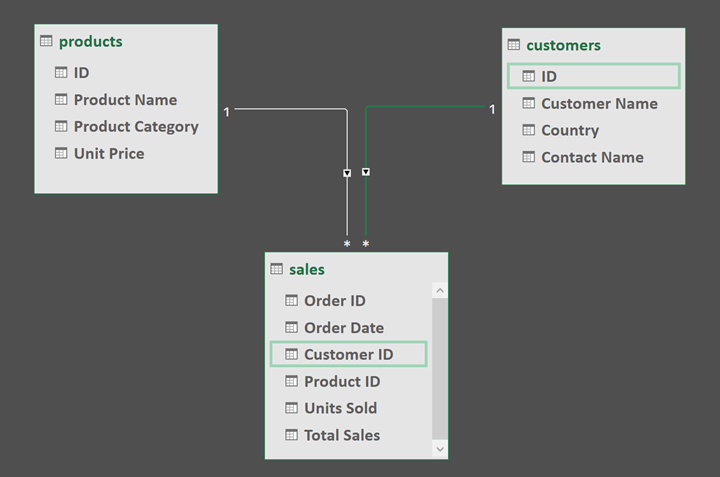
 And the Diagram view where you can establish the relationships between your tables.
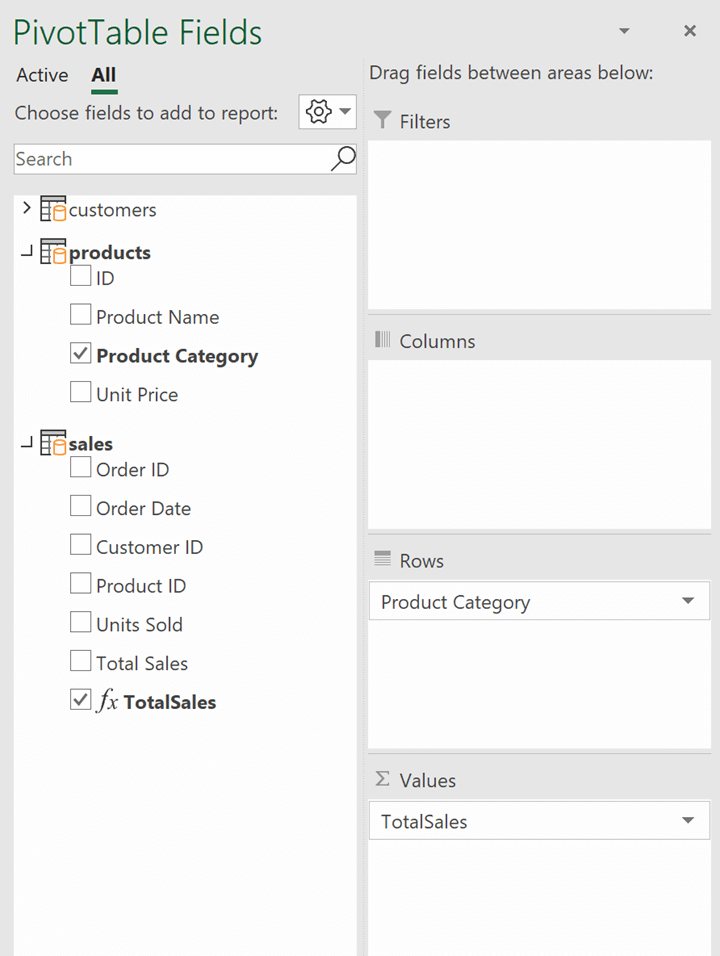
 When your model is set up, you can analyze and report on your data using PivotTables.
The field list below shows a PivotTable using three tables from our Power Pivot model.
What is Power BI?
Power BI is a term used to describe two different tools - Power BI Desktop and Power BI Service (also referred to as PowerBI.com).
You can get to try Power BI for free when you sign up for a Microsoft Fabric free account—an all-in-one analytics platform for businesses and data professionals. For individual use, you only need the free Desktop app and a free Fabric license to publish reports on your workspace.
However, to share content with others, you’ll need a paid subscription, which could be Power BI Pro or Power BI Premium Per User (PPU). Both PPU licenses and paid Fabric licenses enable organizations to access Power BI Premium features.
This tool uses the same Power Query and Power Pivot engines to get, clean and model your data ready for reporting. So when you learn these tools in Excel, you are learning them for Power BI Desktop also.
In the image below, you can see similar buttons to what you find in the Power Query and Power Pivot tools. And then more for reports and publishing.
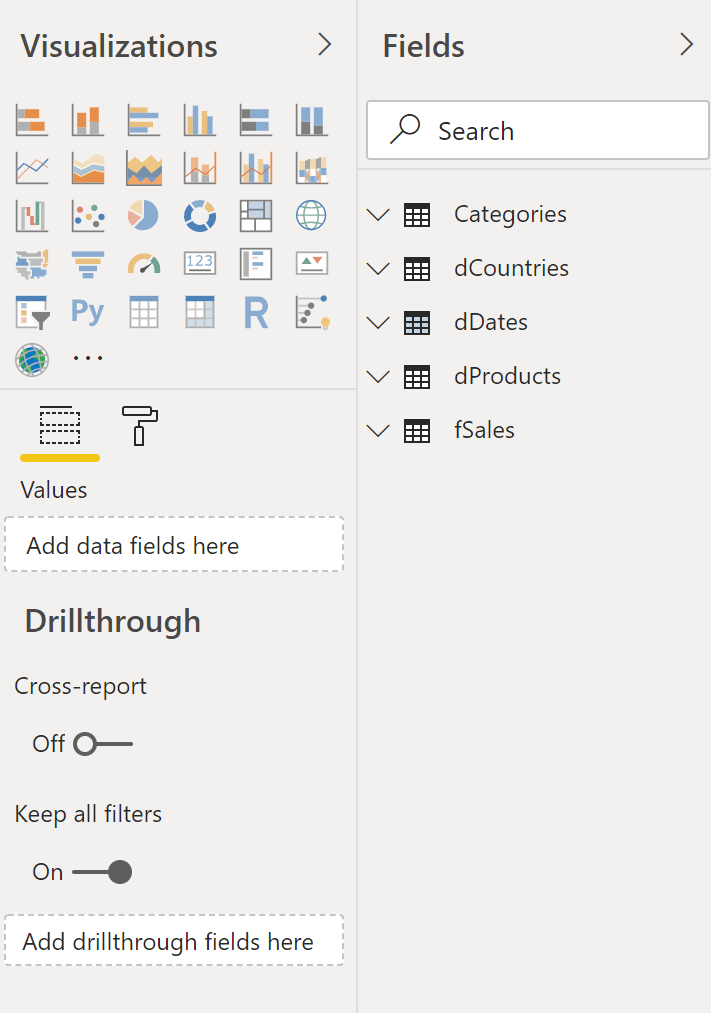
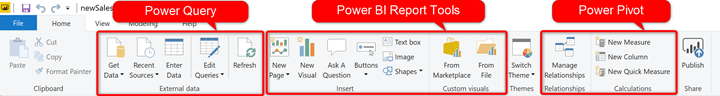 Power BI strengths over regular Excel are in its visualizations. Visualizations is the name assigned to the charts, slicers, tables and matrixes that you can insert into your reports in Power BI.
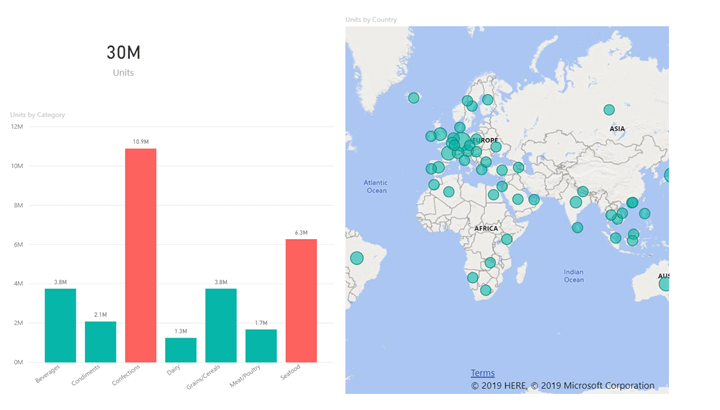 Power BI has a greater choice of visualizations than Excel, and lots of options for how they interact with the other visualizations on a page, or even across the entire report.
 This list is constantly growing, with more available to download from the marketplace and the ability to create your own custom visuals.
Power BI Desktop is where you create your model, perform your DAX calculations and build your reports. These can then be published to PowerBI.com.
Once published, others can view and interact with your reports at PowerBI.com. They can do this via any browser or mobile device.
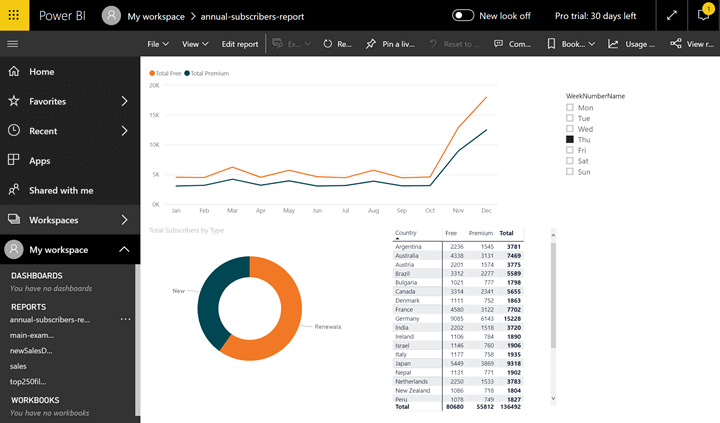 You can also create dashboards using the PowerBI.com service to show the highlights from your reports. And refresh existing reports shared with you.
To get some practice under your belt, follow our step by step guide to creating a Power BI pie chart.
How do these tools work together?
Power Query and Power Pivot do not both need to be used. They are independent tools and you may just need one or the other.
Power Query can prepare simple but large datasets for analysis. Power Pivot is for more complex models and more powerful calculations than Excel worksheet functions or PivotTables alone.
Although they can be used independently these two tools do complement each other. Power Pivot contains features for importing and shaping data, but it is recommended to leave this job to Power Query.
The data is then loaded to the model for Power Pivot to begin establishing relationships and creating measures using DAX.
Power BI is a completely separate tool that has both of these tools included. It has more connection options than Power Query in Excel. It also has better visualizations and can publish to the Power BI Service for better sharing of reports.
Power BI can be like bringing a hammer to mash your avocado though and Excel is the product that workers recognize and love.
And there are benefits to speaking people’s language by using the tools in Excel, unless you require the better visuals and other capabilities that Power BI provides.
| Excel Power BI | Power BI | ||
|---|---|---|---|
|
|
Power Query |
Power Pivot |
Desktop & PowerBI.com |
|
Role |
Import and shape data |
Data modeling and calculations |
Complete business intelligence tool |
|
Language |
M |
DAX |
M and DAX |
|
Key strengths |
|
|
|
Time to power up
These three power tools can take you beyond the physical limitations and calculations available in regular Excel.
Power Query and Power Pivot are available in Excel so anybody can start to explore their capabilities and use them in their data retrieval, shaping and analysis.
Power BI Desktop takes things further with its extensive interactive visualizations and ability to share reports in any device.
If you are looking to develop your skills beyond standard Excel, GoSkills offers dedicated courses on Power Query, Power Pivot, and Power BI that will quickly get you up to speed.
Get started today with a 7 day free trial of all GoSkills courses.