Learn Finance
Learn Finance
This Finance for Beginners resource will provide you with all you need to become a financial wizard.
Trusted by more than 10,000 teams worldwide
Start for freeFinance is the universal language of business. Every business decision in every department has a financial component to it.
It pays to learn finance. It doesn’t matter whether you are in HR, Sales, IT, Admin or Support, you still need to speak the language of finance. Whether discussing plans, strategy or how well your department is performing, you’ll be conversing in financial terms and numbers.
If you can’t speak the language of finance, it means you can’t communicate well, which means you won’t be involved in important decisions.
But if you can speak the language of finance, your value to the organization will dramatically increase.
So, what do you need to know to learn finance?
You’re probably reading this because you are directly managing financial resources in the organization. These could be a project budget, a department budget or product costs.
Let’s take a minute to identify the things you need to know to talk finance. We won’t try to turn you into an accountant, but if you learn finance basics, you will be much better equipped to speak the universal language of business.
Before we dive in though, let’s discuss what you don’t need to know about finance.
- You don’t need to know how the stock market works, as you aren’t buying and selling stocks.
- You don’t need to know the nuances of accounting, as you aren’t preparing your organization’s tax forms or ensuring that SEC filings are compliant.
- You don’t need to know how the corporate treasury function works, as you aren’t meeting with bankers to borrow money or issue bonds.

You need to know about the money and transactions that you are responsible for within the organization.
- You need to know how to make requests for funding and budgets.
- You need to plan how you will spend the money in your budget.
- You need to track and report on the status of the accounts for which you are responsible.
- You need to understand how your spending impacts the organization’s financial reports.
We will address each of these topics in this resource.
First, we’ll begin with financial transactions – the fundamental building block of finance. If you don’t understand this, nothing else will make sense.
Next, you’ll learn about business planning and budgeting. When you understand the budget planning process, you can effectively request the money and resources you need to do your job. Part of understanding budget planning includes understanding the terminology and analysis used by the business to make strategic planning decisions.
Finally, you’ll learn how the business reports its financial status and measures its financial performance.
Once again, we’ll discuss all of the above from the standpoint of a business manager. You’ll learn how your project or department impacts financial statements and metrics.
Well, that’s enough overview, let’s get into the meat of this guide. We’re starting with financial transactions.
Time and money: the two halves of every financial transaction

There are two equally important attributes of every financial transaction – the amount and the date.
Most managers have more control over the date of the transaction than the amount. Business processes often set the amount, which could be a negotiated price with a supplier. Or it could be the agreed upon salaries and bonuses for an employee. The amount could be the fixed rate for services in a customer service department.
Regardless of the amount, the date isn’t set until it occurs.
A manager can delay or accelerate an activity, which will change the transaction date. Keep in mind that changing the date can change a financial report. This is because financial records are tracked and reported based on specific dates and time periods.
Therefore, changing the date of a transaction moves it from one report to another.
With that being said, let me be clear: While the date changes, the amount does not.
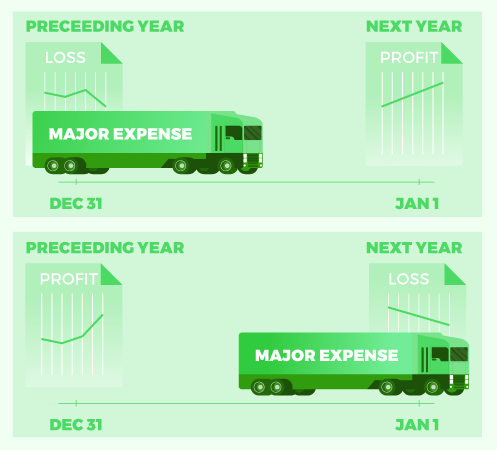
That means that you must manage the date as closely as you manage the amount of every financial transaction.
This surprised me when I first became a manager. I had a budget amount for doing work assigned to my unit. I couldn’t understand why anyone cared when I spent the money as long as I did the work. But I quickly learned, it’s the dates on the financial reports that drive many decisions.
Let me illustrate this with an example.
Have you ever received an email near the end of a quarter or the end of the year saying, “Don’t spend money!” or “Don’t travel!”?
Or have you ever been asked to spend more money at the end of a quarter or a year?
In both cases, the organization is trying to manage the results and ratios on the financial reports. By changing the date – but not the amount – when a transaction occurs, the report changes. This will be an ongoing theme in the rest of this guide.
Budgeting sets both planned amounts and planned dates for transactions. Variance reporting is for a month, quarter or year. Return on investment (ROI) analysis considers not only when the business spent the money but also when it realized the benefit. And of course, key business metrics, like profit, are calculated for a set period. Only the transactions in that period will impact the profit calculation.
Project budgets and reports: the financial path for achieving a goal
A project is a set of activities undertaken to achieve a specific goal within a specific timeframe.
Project activities require resources to accomplish the work. The resources required will depend upon the project’s goal.
For instance, a large event must pay for the facility and entertainment. A new website project must pay, at the minimum, for the developers’ time and efforts. Regardless of the type of work, projects take money.
In addition to money, projects require deadlines. Projects can’t last forever. There is always a start and an end date, and most include a project plan that schedules when each of the activities should occur.
At the beginning of a project, the required resources to complete the activities are estimated (or quoted).
For each activity, there is an estimated amount of money and time to do that activity.
Combining the money and time required for each activity creates a time-phased project budget. A “time-phased budget” means that there is an estimated amount of money that the project will spend each month from the beginning of the project until the end. This budget shows how much money should be spent during each period of the project.
Of course, this budget is just a guess (an estimate), which means it could very well be wrong, which is why we must carefully plan and manage the budget.
Below, we outline the four levels of uncertainty in project budgets.

The list of activities
Does the project budget include money for everything that must be done, or did we forget something? Do we need every resource that’s listed?
The effort required to complete each activity
The budget estimates the amount of money, based on the required effort, to finish each activity. In other words, how many hours, days, or weeks of work are needed to accomplish the activity successfully. This is a variable uncertainty.


The cost of the resources doing the work
When planning a project, you usually won’t know who will complete the activity. And, of course, cost will vary depending on who does it. Will it require a senior-level professional, or can the summer intern do it? Where will the individuals be doing the work? Well-defined projects have little uncertainty.
The timing of when the activity is performed
The project schedule dictates when activities should occur. The project budget details when money will be spent, which is based on that schedule. Challenges arise because many activities depend on the completion of other activities. So if one task is late, it can cascade through the entire project, causing delays, which means a change in the timing of a transaction. On the other hand, some activities may get done ahead of schedule, which would result in spending sooner than originally planned.

This is where variances come in.
What is variance in finance?
Because uncertainties create risks, actual spending is closely tracked and compared to the planned spending initially scoped out. Projects seldom finish exactly on budget. The project manager must be able to explain throughout the project why the spending is different than planned. The difference is called a “variance.” Senior management closely monitors this because they want to know if the variance is increasing or decreasing.
There are three reasons for fluctuations in spending. These reasons are related to the uncertainties we just discussed.

1. A change in the schedule of an activity. In this case, spending occurs sooner or later than planned. Once the project ends, this variance will disappear, and at the end of the project, all money should be spent. Whether it’s spent earlier than planned or later than planned, the money is still spent; therefore, there isn’t any remaining variance due to scheduling.
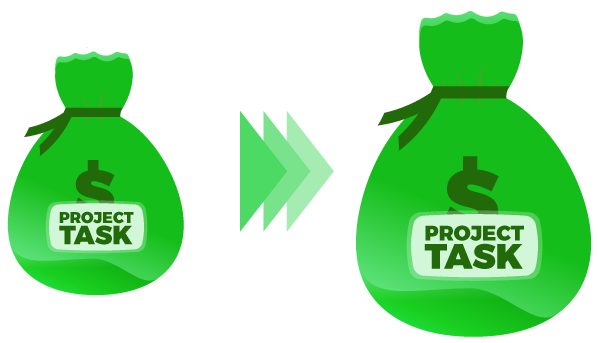
2. A change in resources. In this case, the resource completing the work changes, which means the price to perform the activity changes as well. The change in spending creates a variance. This variance will usually be permanent.

3. A change in the amount of work to be done. In this case, the resources required to carry out the work is incorrectly scoped out. Maybe we didn’t fully understand what was needed when we created the project plan. Or maybe we missed a required activity. Whatever the case, we didn’t plan for a risk that occurred, or we didn’t understand how difficult a task was, this will be a permanent variance to the project budget.
There is also an associated risk with this variance. When it seems like you have extra, unplanned work to complete, make sure the work is necessary. Don’t add activities unless they are required to achieve the goal(s) of the project. If you’re managing a project budget, you’ll probably have to provide a status report on variances. The finance department will likely send you a regular (probably monthly) report on your project.
The report may use a unique set of financial accounting principles, known as Earned Value Analysis. This is the best methodology for tracking and reporting a project’s financial status.
While it’s too intricate to discuss here, consider enrolling in our Finance for Project Managers course to learn finance online and master specifics like this.
Don’t worry if your organization does not use Earned Value Analysis. It just means that you will need to do the variance analysis I just described manually.
Department budgets and reports: how to prepare a budget for an organization
In many respects, department budgeting and reporting is easier than project budgeting and reporting.
Typically, a department budget is created during annual business planning. Every business does this a little differently, but they usually follow a universal pattern.
To create the department budget, the department manager reviews what was actually spent in the department during the previous year.
The manager then makes the appropriate adjustments to those numbers. For instance, if the department is increasing or decreasing staff, the personnel costs will change; and the general supply costs and travel costs will fluctuate due to inflation/deflation.
If nothing changes, next year’s budget should be whatever the business spent the previous year.
Typically, several changes must be made each year.
- Appropriate inflation or deflation effects for each of the categories of expenses.
- Changes to personnel costs based on any hiring, firing or organization restructuring.
- Changes to any utility or support costs due to adding new systems or facilities, or removing old systems or facilities.
- Changes to planned spending on corporate initiatives as new ones are added and old ones are retired. Any one-time costs needed to implement the corporate strategy, for example, increased travel expenses of integrating a company that was acquired.
- If project budgets are part of the department budget, include next year’s portion of the project budget in the department budget. In this instance, this means that the department budget would include costs for a project developing a new product.
When tracking departmental costs and variances, the reasons for variances are typically easy to determine.
For example, variance in personnel costs occurs when there are two open positions. With staff down by two people, we don’t spend all the money that we planned to spend. There could also be a variance when relocation to a new office facility gets delayed by two months. The utilities and support costs may have a variance because the charges are different between the two buildings.
In addition to variance reports, department managers are often asked to forecast how much money they will spend over the year.
To assist department managers with forecasting, finance organizations will often create a Cost Performance Index (CPI).
CPI = Actual Spending ÷ Planned Spending
A CPI ratio is calculated for a particular point in time or a certain period. If the CPI ratio is a point in time, the calculation is the actual money spent since the beginning of the year divided by the planned spending up to that point.
If it’s for a period (such as a month), you will calculate the actual amount spent during that period divided by the amount of money planned to be spent during that period.
Both approaches are useful. Be sure you know which method your finance department uses.
And finally, if actual spending is exactly what was planned, the CPI value is 1.0.
If the department is “underrunning,” the actual spending is less than planned. In that case, the CPI is less than 1.0.
If the department is “overrunning,” the actual spending is greater than what was planned. In that case, the CPI is higher than 1.0.
To forecast total department spending, multiply the CPI by the total department budget. For instance, let’s say my department budget is $1 million. If halfway through the year the CPI is 0.9, I’m currently underrunning.
I can find my forecast by multiplying the CPI by the budget. The forecast is then $900,000, which means I will end the year under budget by $100,000.
If instead, the CPI at the halfway point was 1.1, then I am overrunning. When I multiply the CPI by the department budget, I get a forecast of $1.1 million. That indicates that I will overspend by $100,000 by the end of the year.
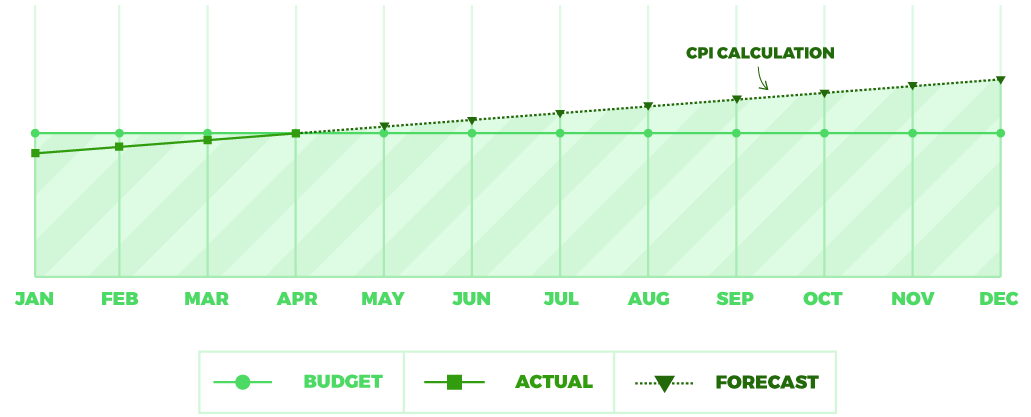
There are several things to look out for when using CPI to forecast:
- Remove any one-time special charges that will occur since these are not part of the regular department activities. An example would be if you relocated to a new office and you had moving charges during the month of March. Since you will not be moving again this year, any overrun or underrun for those activities won’t be repeated.
- Don’t start to forecast with CPI until you have at least three months of data. Otherwise a minor difference in spending in one of the first few months can cause a large change in the CPI.
- By the time you have three months of data, if there is a real trend, it will likely be evident.
- While your budget assumed that your costs would be similar to the previous year, some may follow a different pattern. For example, travel expenses or repair costs may occur at a different time than the previous year. If a number of the costs and the timing are significant, it can impact the CPI.
If any of those conditions exist, you can still use the CPI, but you must be aware of the likelihood that the forecast will be wrong and account for that.
In a large or stable organization, like a university or well-established industrial business, department spending typically tracks close to the plan. If an unexpected business event occurs, such as a labor strike or facility damage, it’s usually easy to renegotiate the budget based on the new business reality.
In a small business or startup, the department budget will often be significantly different from the plan because processes and relationships aren’t stable, so the previous year’s spending isn’t representative of the new year.
In fact, as a business grows and changes, the department structure often morphs. It may change several times during a year, making it almost impossible to create an accurate budget based on last year’s spending.
In this case, treat the department more like a project, and follow the project budgeting and tracking guidelines outlined above.
Are your products making money or losing money?
We have spent a lot of time on budgets and variance reporting. But your organization is in business to make a profit. And department or project budgets don’t tell us anything about profit. So let’s switch gears now and look at how we make money.
If you’re in an organization that has products for sale, you can bet that the financial analysis is often centered around understanding product costs and gross product profit.
Let’s start by defining some terms – or common working definitions used by operating managers.
Accountants may define these terms using financial terminology, but we’re defining them based on how a unit manager thinks of them. Please note that terminology may vary from organization to organization.
Each definition will include an example to illustrate the point. My example business is a company that makes bicycles.
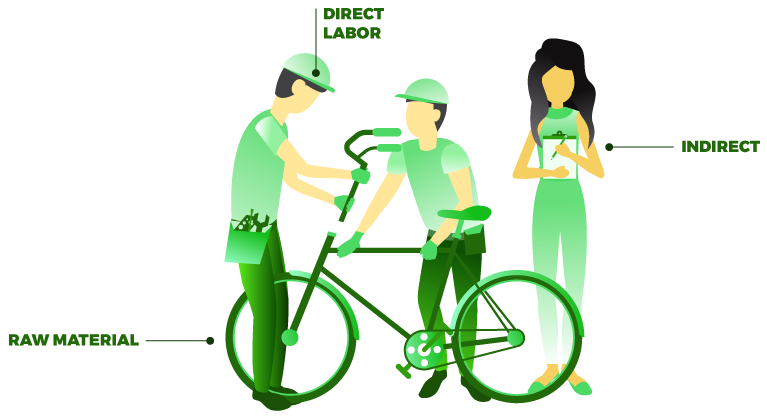
Product Unit Cost: The direct cost of producing one more item without changing any of the business processes or infrastructure. It is comprised of:
- the Raw Material Cost
- the Direct Labor Cost
- and the Indirect Cost
It’s the cost to make a bicycle. It’s the frame, the wheels, the seat, the handlebar, the chain and the brakes. It’s the cost of the parts, the cost of the labor to assemble and paint it and a small fraction of the cost is the overhead to run the manufacturing facility.
It’s not the cost for product development projects to design the bicycle. It’s not the cost of the marketing, sales, IT, HR or finance departments that help run the business. It’s not interest costs or taxes.
Product Unit Cost = Raw Material Costs + Direct Labor Costs + Indirect Costs
Raw Material Cost: The cost of the purchased supplies and components that go into a product that will be sold to a customer. In our example, it’s the cost of the tires for the wheels and the steel tubing for the frames. It isn’t the cost of computer servers used in IT or the cost of leasing cars for the sales team.
Direct Labor Cost: The cost of the in-house labor that fabricates, assembles, inspects and tests a product that will be sold to a customer. Labor costs are always in-house costs. The labor costs at our vendors are part of the material costs that we pay to the vendor. Labor costs are only for work directly on building the product. For our bike shop, it’s the labor cost of bending the steel tubing to make the frame. It’s the labor cost of assembling the pedals, gears, chain and shifter to the bicycle. It’s the labor cost of painting the bicycle. It isn’t the labor costs of training our operators. It isn’t the labor costs of administrators, even if they are in the manufacturing department.
Indirect Cost: The cost of the in-house support of the fabrication, assembly, inspection and test processes that make the product or item that will be sold to a customer. These are usually a small fraction of the Unit Product Cost. These costs are spread across all the products being built, so only a small fraction will apply to one item. In our bike example, it’s the cost of the shop supervisor, the cost of maintaining the equipment used in the bicycle production, and the cost of shipping materials. It isn’t the costs of any other department except operations.
Product Price: The average selling price of a unit after applying any discounts or concessions provided to the customer. This is the amount of money that the manufacturer gets when they sell the product. In our bike example, it’s the price that the customer actually pays. So when we have that 10 percent off sale at Christmas, it is 10 percent less than the rest of the year.
Product Gross Profit: This is the measure of profitability at the product level. It’s the difference between the product price and the product unit cost. It’s the profit earned by the company if they make just one more unit and sell it. If product price increases and product unit costs stay the same, then product gross profit increases. If product price stays the same and product unit costs increase, then the product gross profit decreases.
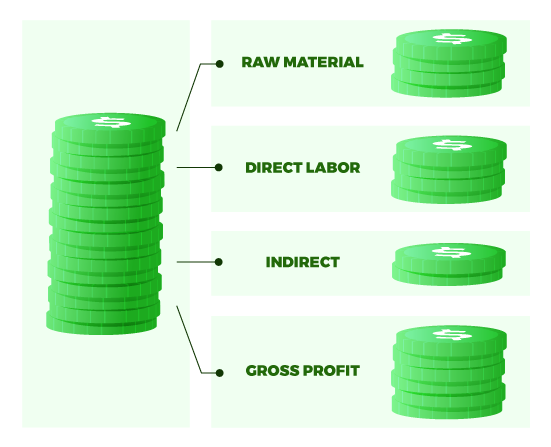
Product Gross Profit = Product Price − Product Unit Cost
Now, you may be thinking all this is just gobbledygook. Why do we even care? There are a couple of things to consider.
This is the language of product cost and product profit. We said at the beginning of this resource that when you learn finance, you also learn the language of business. Just like any other foreign language, it has its unique words with its meanings and these words are used in business language for these concepts.
But even more importantly, we need to understand these concepts because the way we will manage each of them is different.
Let’s start with the Product Unit Cost.
The Product Unit Cost is determined by two different business processes.
The first is the design decisions made by R&D. They decide what materials make up the product. And the design decisions determine how easy the product is to assemble and test.
The second process is the daily management of the operations departments. The purchasing organization negotiates the price of the materials. The manufacturing department manages the labor doing the production.
This means that the R&D department, the sourcing or purchasing department, and the manufacturing department share the responsibility for product unit cost.
So who is responsible for managing costs?
The short answer is, “It depends!”
In many organizations, the R&D department will have a cost target for a new product. They are responsible for creating a design that is below the target price.
The result of their design process is a list of all the parts in the product, called a Bill of Material.
In some cases, production is automated, meaning that it’s built by machines and robots. When that’s the case, R&D also designs the automation.
In most organizations, once the product moves from development to production, the R&D department is no longer accountable for product unit cost.
When production starts, the purchasing department is usually responsible for the direct material costs. They negotiate with suppliers to find the best deal for the items that R&D listed on the Bill of Material.
When production starts, the manufacturing department is responsible for the direct labor and indirect costs. Manufacturing operations will setup the factory processes based on R&D’s design. Then, they will use the automation equipment produced by R&D. If nothing is automated, they’ll create manual processes to assemble the product.
Manufacturing then manages the processes based on business goals. In some cases, it’s to manage for the lowest cost. In other cases, it’s to control for the highest quality. And in other instances, it’s to ensure that the automation system is running most productively.
These goals may be in perfect alignment so that when you get one, you get all three. But often, optimizing one means that you can’t get the most out of another.
For instance, the lowest cost may not lead to the highest quality.
Manufacturing must manage based on what leadership chooses as the primary goal.
It’s no surprise, then, that many organizations track product unit cost like a hawk.
However, if they manage each of the three components – raw material, direct labor and indirect costs – separately, they can create sub-optimal cost performance.
The purchasing department tracks the raw material costs. But the least expensive raw material supplier may have late deliveries. This means that manufacturing must work overtime, which drives up direct labor costs.
Manufacturing tracks the direct labor costs. One way to reduce labor is to automate more. But shifting to automation requires more equipment and the cost of maintaining that equipment, which increases indirect costs.
Normally, manufacturing is responsible for indirect costs as well.
Indirect costs may be decreased by reducing the maintenance and setup costs for automation. However, these reductions can lead to high scrap rates. High scrap rates mean that purchasing must buy more material, and manufacturing must use more labor to build replacement units for the ones that are abandoned.
Another example is when manufacturing jobs are transferred to low labor cost areas to save on direct labor. Often, this will lead to higher indirect costs since both the overhead support and shipping costs increase.
Many organizations assign a product manager to oversee the product unit costs and the product price. Product managers work with marketing and sales on product pricing decisions and with purchasing and manufacturing on managing the product unit cost. By doing this, they can control the gross product profit.
Product gross profit is a more meaningful metric than either cost or price because it reflects the real financial impact of selling one more unit. For example, say I lower the bike costs by 10 percent, and the bike price drops by 20 percent. When I look at gross product profit (price − cost), it is down. All the savings from the lower cost are swept away by the much lower price.
Now, let’s look at the example in reverse.
Let’s pretend we want to make the bike a premium bike. We change the materials and increase the costs by 10 percent. As a premium bicycle, we can sell it for 25 percent more.
In this case, although costs went up, the higher price increased our gross profit.
One final comment on tracking product unit cost. This is one of those finance rules that sometimes make things seem confusing.
The costs to make the product occur when the product is being manufactured. But within the financial accounting system, every product being built must be tracked. A partially built product only includes part of the costs. So the cost assigned to each item being produced depends on the stage of production.
Therefore, in the financial accounting system, a product is tracked in one of three accounting categories.
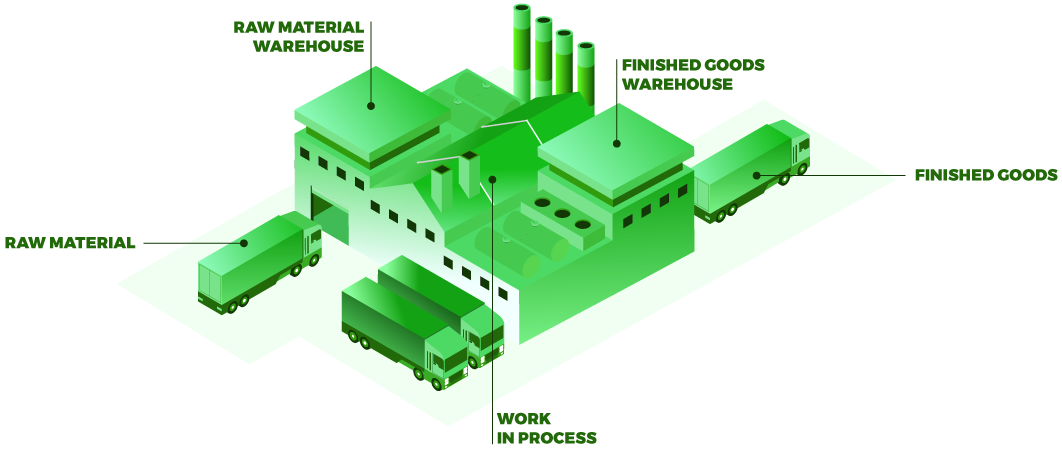
1. Raw Inventory: This applies to the raw materials and components that have been purchased for use in production. The manufacturing steps have not yet started, so there is no labor or indirect costs.
2. Work-In-Process (WIP) Inventory: This is the value of the Raw Material, Direct Labor, and Indirect Costs for partially built units. The manufacturing process has started but hasn’t finished yet. As a production unit works its way through the manufacturing process, its WIP value increases.
3. Finished Goods Inventory: This is the Product Unit Cost value. The unit has been manufactured and is ready to be sold to a customer. It contains all of the required Raw Material, Direct Labor and Indirect Costs.
Many businesses track these three categories as a way of regulating the production process. If the production process is flowing smoothly, the relative amounts of inventory in each category will be similar.
Your finance department will have guidelines for appropriate levels based on your industry.
Implementing competitive advantage: the strategic planning and budgeting processes

Everybody wants to be a winner. And financial performance is the measure of business success.
When measuring financial performance, normally, two questions are asked:
- Is the business performing better than last year?
- Did the company achieve its financial targets?
Organizations must have a competitive advantage to improve and meet KPIs continually.
The strategic planning and annual budgeting processes determine the strategy and set the business financial targets.
The financial targets are presented to external stakeholders as a company forecast, and the financial targets are delivered to internal managers through their annual budgets. When the process is working, managers can be confident that maintaining their budget is their contribution to fulfilling the business strategy.
So what are the elements of a well-run strategic planning process?
Let me start by saying that the process is different for a startup company as compared to an established organization.
Let’s look at the established business process first. I’ll use an online retailer, selling fashion products, as an example to illustrate the principles.
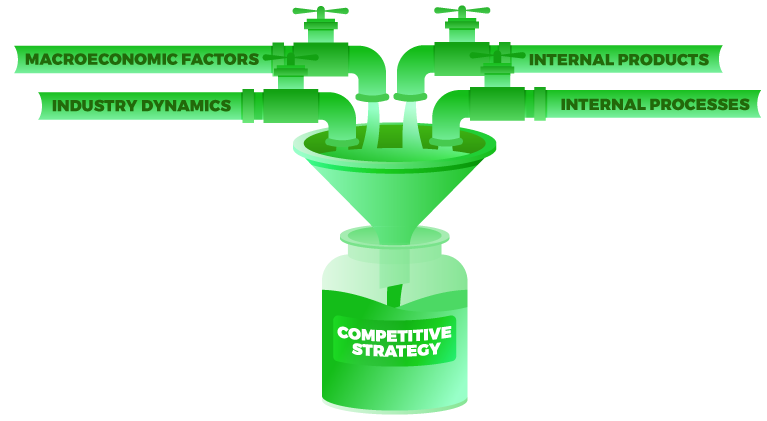
Coming out of the small end of the funnel is competitive strategy.
The process kicks off with a review of industry dynamics and macroeconomic factors that could impact the business.
In our example, the company evaluates several things.
They look at their competitors and determine who has an advantage and why. Then, they review the latest Internet trends that could change the way they interact with customers. Lastly, they review the projected growth and spending patterns of the middle class in countries all over the world.
While this is happening, the company also reviews its internal processes, products and services to determine what it’s doing well and what it can improve. For example, our Internet retailer discovered children’s and sports attire was flourishing while its other product segments were performing poorly.
Compared to its competition, the retailer was doing best in Asian markets and weakest in European markets. They also discovered that the South American market was growing rapidly, and there was no market leader yet. Finally, they learned that its internal order-to-ship cycle was slow compared to the industry standard.
All of the above findings combined to create a competitive strategy for our online retailer.
Based on this strategy, plans for each business department are then formed to support its strategic competitive advantage.
Based on what our Internet fashion retailer learned above, its plans would probably include:
- Adding additional products to the children’s and sports apparel categories.
- Creating a major marketing campaign to break into the rapidly expanding South American market.
- Planning how to speed up the order-to-ship cycle time with improved equipment and systems.
That is the high-level process.
Every organization does things a little differently. Based on how well they do this, they can establish competitive advantages.
Throughout the process, operation managers can count on being asked “What if...” questions. These are not yet firm plans but are part of the analysis and development of the strategy for competitive advantage. Take the questions seriously, but don’t get lost in the details.
When leaders settle on a strategy, you’ll have a chance to create a more detailed plan. At that time, you can determine the project budget or the full effects that the strategy will have on the department.
Recall that we discussed these when talking about the creation of a department budget earlier in this guide.
Of course, not every organization performs this process well. In fact, many companies follow a very different process. They drift along without making a conscious decision to pursue a competitive advantage; instead, they go on defense.
In these organizations, the strategic planning and annual budgeting processes are straightforward. Management reviews all of their “good ideas”. Then, they pick a few to implement. If they’re lucky, they pick ideas that will improve or sustain their organization
Not surprisingly, organizations that operate like this often have a fiery strategic planning meeting.
Each senior manager has their favorite idea that they want the business to execute. They argue to get their idea funded, or at least to make sure that no one else’s idea will reduce their responsibility or the size of their department.
They can never agree because there are no judgment criteria for the proposed ideas. So it often comes down to who yells the loudest.
Organizations that follow this approach often create internal confusion, funding ideas that aren’t coordinated throughout the organization.
You may be wondering why anyone would follow the latter approach.
The answer?
The first approach takes time and effort. It can be difficult to allocate time to planning when management is swamped with their day-to-day activities.
Additionally, when an organization is running smoothly, there is a tendency to not “rock the boat.” Therefore, although most leaders claim they follow the first process, in reality, they typically follow the latter one.
Now, you may remember that I said the strategic planning process for startups was different. Let’s dive into those differences.
First, startups typically know its strategic competitive advantage. They have seen a need in the market, or they have an innovative idea that they think will attract a customer base.

Typically, in a startup, there are very few established business departments and processes. So they must prioritize first.
Do they need the website first, or the marketing plan, etc? Well, it depends on their strategy. And let’s face it, it often depends on what the investors think is most important for the business.
So the strategic planning process for a startup is a prioritization process. They usually have loads of great ideas, but they need to choose to focus on the one with the most immediate impact.
Regardless of approach used, leadership will finally decide what it intends to do for the coming year.
Now, we move from strategic planning to annual budgeting. I grouped these together because, in well-run companies, these two processes fully integrate with each other.
To discuss annual budgeting at a business level, we need to define two new terms that we have not yet covered.
What are CAPEX and OPEX?
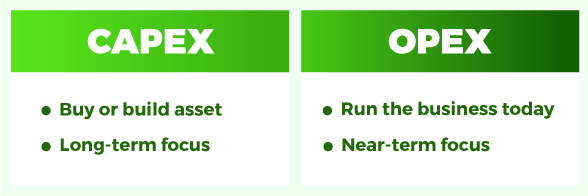
The first of these is “capital expenditures” or CAPEX.
CAPEX is a unique category of spending that has significant implications for both taxing and reporting purposes. It’s money that is spent to create a new business asset, i.e. money spent on land, buildings, equipment, and certain types of intellectual property. In other words, it’s something the business will reap value from for a long time.
The other term is “operating expenditures” or OPEX.
OPEX is all the money spent in the business that is not CAPEX. Basically, it means all the money used to run current business operations.
One way of thinking about these is: CAPEX is money spent to create future business value, and OPEX is money spent to run the business currently.
So why care? Well, once the strategy is set, the elements of the strategy must be allocated into the categories of CAPEX and OPEX and then assigned to a business department. I’ll illustrate this point with the online retailer we discussed earlier.
The business wants to add more children’s apparel and sports attire to maintain its competitive advantage.
The business wants to do a major marketing push in South America to take advantage of the opportunity.
And the business wants to improve its order-to-ship process.
Adding more products is OPEX, which impacts the sales and marketing department because they need to promote and sell these products. It also impacts the IT department because it will need to add products to the online store. And it impacts purchasing and shipping to acquire and ship these products.
Think back to when we talked about department budgeting at the beginning of this resource. Each department starts with what it spent last year. Then, they add the effect of these new products to their proposed budget.
The marketing campaign in South America will also be OPEX. The marketing department will likely be doing the spending and possibly the sales department if they hire more sales people to focus on South America. Again, those departments will add those costs to their budgets.
The third part of the strategy may have some CAPEX. If the business modifies its buildings or buys new equipment to improve the order-to-ship process, that will be CAPEX. However, if they just hire more people, it will be considered OPEX.
If the OPEX and CAPEX rules seem confusing, it’s because they are.
They have been developed over the years and are based on the tax code, so don’t look for logic in them.
The tax issue is two-fold.
First, everything bought with CAPEX is taxed using the property tax laws.
Second, CAPEX spending is not included in the profit calculation used to determine the corporate income tax.
Fortunately, as an operating manager, you don’t worry about taxes. So let finance deal with that. However, you do need to know how much money in your budget is in each category and manage them separately.
Mixing OPEX and CAPEX can get the business in big trouble with the government on tax day.
So just when you think you may understand CAPEX and OPEX, I want to throw one more concept at you – capitalization and depreciation.
The first rule to remember with capitalization and depreciation is that it only applies to CAPEX, never to OPEX. So if you don’t have any CAPEX in your budget, you don’t need to worry about this section.
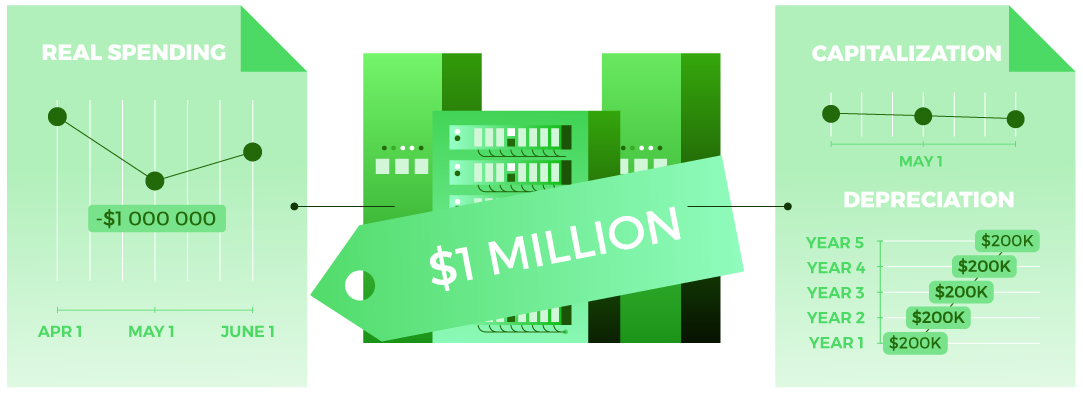
If you do have CAPEX, then you will have capitalization and depreciation.
To understand these concepts, I must remind you that all financial transactions have two parts – the money and the date. With capitalization and depreciation, we don’t change the amount of money, but we do change the date of the transaction.
When CAPEX money is spent to purchase a piece of equipment or modify a building, the date of that transaction won’t be the date of purchase. Instead, the date will be the date the business begins using the equipment or building.
That’s because when something is capitalized, it becomes unusual in the financial accounting system. It’s called a fixed asset, which means that it has long-term value for the business. It’s treated special because the company must pay property tax on fixed assets.
Now for the tricky part of capitalization.
When money is spent on CAPEX, the business does not count it as a standard expense in some of the financial records. In fact, it doesn’t show up at all.
Now to be clear, the business had to pay the money for the CAPEX, but they don’t include that transaction in the financial report that shows the business profit.
So if you spent $1 million on CAPEX, the financial report won’t show it. Instead, the report will look like you made an additional $1 million in profit that year.
Now, if you’re saying, “That’s not right!” don’t worry. The depreciation charge is where we account for the cost.
Depreciation spreads the cost of the fixed asset over the valuable life of the asset. And in case you are wondering, there are accounting rules and tax laws that determine the valuable life of every type of fixed asset.
The depreciation cost of a fixed asset for any given year is treated as an operating expense in that year. In that way, over time the CAPEX cost of the fixed asset is slowly turned into OPEX cost over a period of years.
Fortunately, there are people in finance who manage all the accounting for capitalization and depreciation, so you won’t need to.
Let’s look at an example.
The Internet retailer purchases a new server to run the software that will manage their new order-to-ship process.
Servers are normally capitalized.
Let’s say the server costs $15,000. When the company buys the server, they must pay the supplier $15,000. However, since the server will be capitalized, it isn’t recorded as an operating expense.
Let’s say that the company has the server for three months before it’s installed and starts to run the new software. The day it’s turned on to operate the software is the capitalization date.
From that day on, the company must pay property tax on the server.
Also, on that day the depreciation schedule starts. For simplicity’s sake, we’ll say that the server is depreciated over five years and that we take the same value for depreciation each year – $3,000.
After five years we’ll have fully depreciated the server cost.
(In reality, there are more than 30 different methods used to calculate how much depreciation is applied each year. Finance determines which method is appropriate based on the type of asset.)
Therefore, one year after the server has been in operation, the business will record the depreciation for that first year – a $3,000 depreciation charge.
Again, to be clear, no one is actually spending $3,000. This is just a portion of the $15,000 that was initially spent in CAPEX but not recorded as an operating expense.
One year later, finance will record the second charge for $3,000. This will continue for five years.
After that, there are no more charges. The business can still use the server, but it is fully depreciated.
Now, if you are asking, “Why do we care about this?” The answer is: if your department is responsible for a fixed asset, all of these accounting actions will go on your budget, and you may be asked to explain them.
So when the business decides on the strategy and begins to create the annual department budgets, finance will tell you how much CAPEX you have in your budget and how much depreciation you’ll be charged that year based on the CAPEX spent in previous years.
In an organization that has a lot of buildings and equipment, the biggest items in a department budget may be the CAPEX and depreciation charges.
So, let’s recap.
During the strategic planning and budgeting process, the organization decides what it wants to do. Based on these decisions, the company decides how much CAPEX it must spend.
The required CAPEX and OPEX to implement the strategy is determined for each business department, and its budget is set for the year.
The CAPEX and OPEX money in a department budget is spent in the current year, but the CAPEX doesn’t show up as an expense in this year’s financial statements. This tends to inflate the profit for the current year.
However, a portion of the CAPEX shows up as an expense each of the next few years as depreciation. It’s charged to the department budget even though the department doesn’t actually spend the money. This tends to reduce the profit later.
Given these effects and the tax implications, it’s no wonder that finance closely tracks the CAPEX.
Return on Investment (ROI): when does it make sense to spend money?
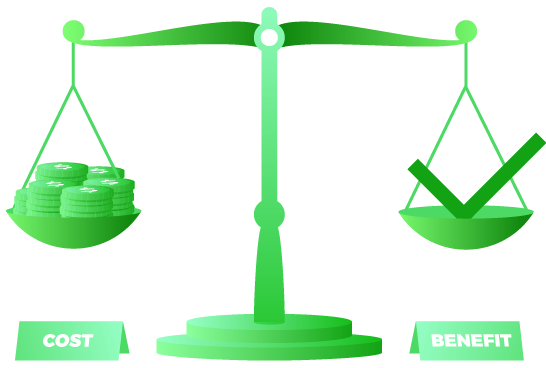
The next topic associated with strategic planning is ROI decisions.
What does ROI mean?
ROI is a calculation that determines how much financial benefit an organization gets from spending money on a project or initiative.
As with many of our previous discussions, timing matters. ROI considers the money it spends, the money it receives, and the timing of both to tell you if spending that money is a good idea.
There are four methods used to calculate ROI. Each of which reviews the investment from a different perspective and provides its answer in a different form.
Some methods are better at answering specific questions than others. I’ll explain the best application of each when I describe it.
With that being said, all methods are accurate and useful, so if your organization requires you to use a specific method, by all means, use it.
What is the Payback Period?
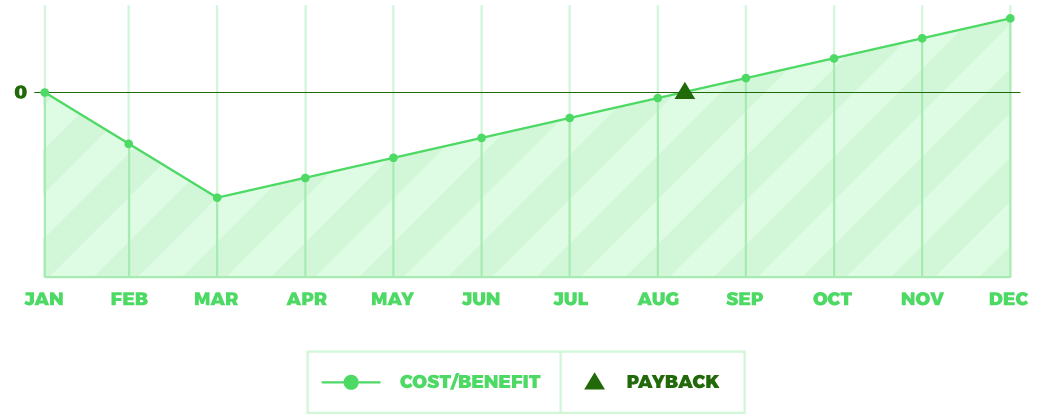
The payback period method provides an ROI answer from a time perspective, in the form of months or years.
The payback period calculation determines how long it will take to make enough money to offset the cost of the project or initiative. I find that this method works well with small, fast investment projects. Especially those that are saving money.
To calculate the payback period, start with the estimated cost and timing of the investment.
Then the benefits are calculated. The benefits could be money that’s saved or new revenue that’s generated.
An example of savings would be an investment in solar panels for the roof of the building to save on utility costs. While an example of new revenue would be an investment in an Atlanta office to generate new business.
Whether it’s savings or revenue, the benefit is usually described as an amount of dollars per month or year.
Next, add up all of the investment costs.
Lastly, add the benefits month-by-month or year-by-year until the total of the benefits equals the total of the investment. The shorter the payback time, the better the investment.
The point in time in which they are equal determines the payback period.
Here’s an example.
Let’s say we decide to invest $10,000 for solar panels.
These panels will save us $200 every month in utility costs.
The total investment cost is $10,000.
After 50 months, we’ll have saved $10,000 in utility costs. That means the payback period is 50 months, or four years and two months.
One caution with this calculation.
The end point of the payback period is clear – that is when the investment and benefit are equal. However, since a payback period is a length of time it also has a start point.
Some organizations start counting the payback period when they start spending money on the investment. Other companies start counting the payback period when they start reaping the benefit.
While that might be the same date for some investments, other investments can take months or years, which can create confusion. This confusion is why I tend to stay away from this technique when working on large, complex investments.
Here’s another example.
If we lease a new office in Atlanta, we need to furnish it, hook up equipment and hire staff.
It may take six months before we have any new sales coming in from Atlanta. So our payback period could start when we sign the lease, or it could start when we make our first sale.
There is no right or wrong way to decide when to start counting the payback period.
Just be certain you’re counting in the same way that the rest of your organization is counting when they calculate Payback Period ROI.
What is the Breakeven Point?
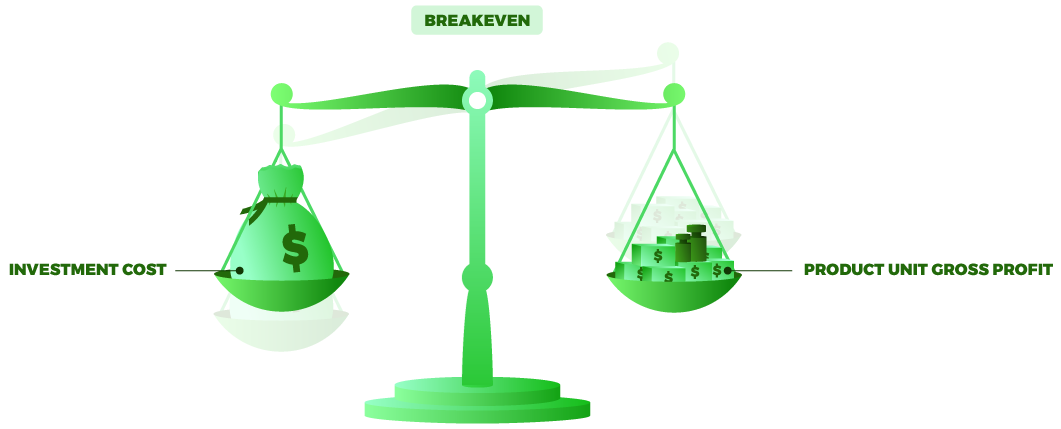
The breakeven point method provides an ROI regarding sales. It is determined by how many units are sold or by how much money is made from sales.
I like to use the breakeven point when conducting ROI for a new B2C offering.
Breakeven is similar to payback period. Both approaches add the total cost of investment and then determine what is needed to cover those costs.
The difference is that breakeven does not count the time periods, it counts how many products must be sold to pay for the project. The fewer the products that are needed to offset the investment costs, the better the investment.
This technique focuses on the market and customers. It’s most commonly used with seasonal consumer products or with exclusive products that have a limited market. It determines how big the market must be for the product to make money.
Here’s an example.
A toy franchise is considering whether to create a special edition of a popular action figure based on the character of a new movie.
The cost to create the action figure is $1 million. The action figure will sell for $25, and the company will make $5 gross profit on each toy sold.
The breakeven calculation shows that 200,000 toys must be sold to generate $1 million in gross profit. And that is how much is needed to offset the cost of the new action figure.
Marketing and sales must then decide if they think they can sell 200,000 of the action figures.
One caution when doing this calculation: Be sure to calculate the unit gross profit for the sales when calculating how many units must be sold, not the actual sales amount.
Net Present Value provides ROI from the value created perspective
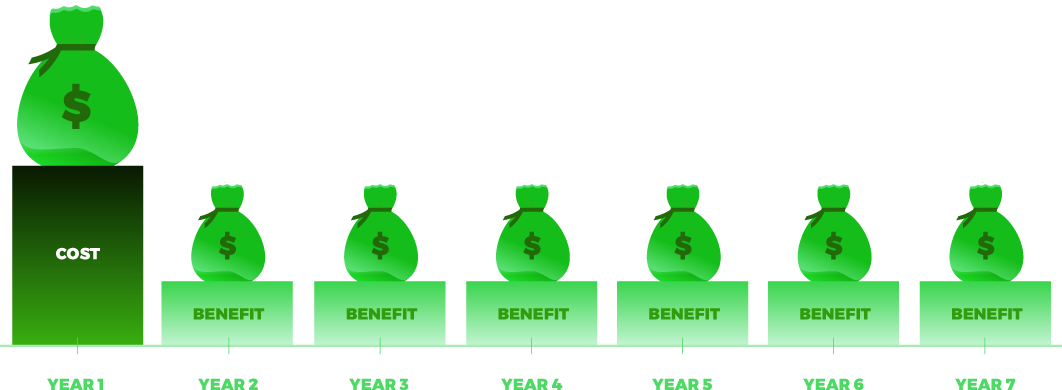
The first two methods are simple calculations.
Determine how much time or sales are needed to offset the cost of the investment.
The next two methods are more complex.
They use the financial principle known as the “Time Value of Money”.
I won’t dive into the details here, but in a nutshell, it says that a dollar in my hand today is more valuable than a dollar in my hand several years from now.
This is due to inflation, and the reasoning that I could invest that dollar today, and make money with it.
The answer for this ROI method is regarding money.
Rather than only considering what it takes to offset the investment, it determines how much money the investment will create for the business.
The Present Net Value (NPV) calculation is commonly used for large projects or initiatives that take several years to complete. They create benefit streams of sales or savings that will last for many years. Since NPV considers the effect of many years in its calculation, it’s often used for long-term investments.
The NPV formula calculates the value to the business over a specific number of years. It starts with the total estimated costs and estimated benefits for each year during that specified time period.
The formula then changes those values to account for the “Time Value of Money” using a Discount Rate that is determined by finance.
Your finance department will calculate that rate every year. They may have different rates for different types of projects, such as facility projects and product development projects. As operating managers we don’t need to create the rate, we just use what finance gives us.
The NPV formula is featured in most spreadsheet applications, such as Excel.
All you need to do is estimate your investment costs and the savings and sales benefits for each year. Then, using the Discount Rate from finance, input all of those values into the formula, and you’ll get an answer.
The answer is how much value the investment creates for the business. Naturally, the more value the better.
Internal rate of return (IRR) provides ROI from an investment quality perspective
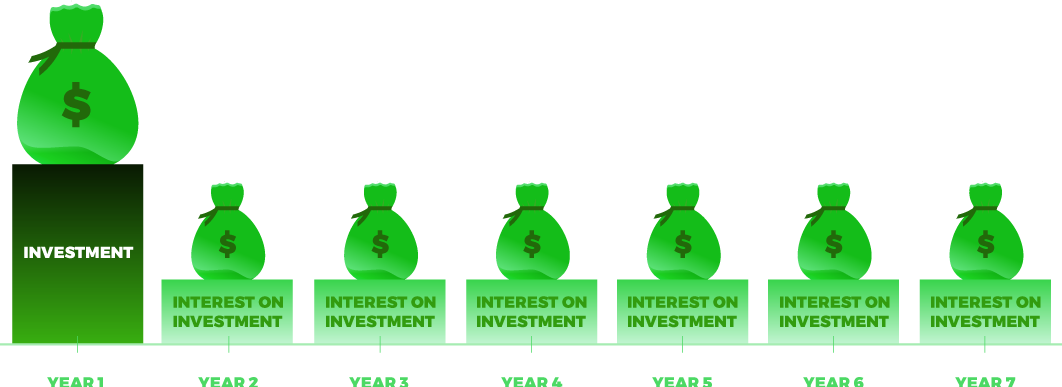
This method is related to the previous method, NPV. Both methods use the principle of “Time Value of Money”.
In fact, both use the same formula.
You may recall that I said the formula uses a Discount Rate that we received from finance. In the IRR calculation, we don’t get a Discount Rate. Instead, we calculate what the rate should be. This rate is called the Internal Rate of Return.
Once again the formula is too complicated to show here, but fortunately, it is already in spreadsheet applications, like Excel. Just input your investment costs and sales and savings benefits for each year, and the formula will calculate the IRR.
Think of this as the interest rate on a money market account.
If we invested the money to do this project in a money market account, the IRR is the rate the money market account would need to pay us to get the same benefit. (This is not exactly correct due to some of the rules in the banking laws, but it is approximately correct.)
IRR is often used when an organization must borrow money or obtain financing for an initiative. The lenders need to see the rate of return or yield expected from the investment before they’re willing to lend money.
As you can see, there are many ways to calculate ROI. Here are the high-level bullet points.
- Payback period is excellent for small, fast projects. It tells us how long the money is tied up before the investment has paid for itself.
- Breakeven point is great for new products or new markets. It tells us how many sales we need for the investment to pay for itself.
- Net Present Value is perfect for large, multi-year projects. It tells us how much business value the investment will create.
- Internal Rate of Return is helpful for investors. It tells them the financial return rate the organization expects to reap from the investment.
The business reports results with financial statements
| Earning Statement | Balance Sheet | Cash Flow Statement |
| Profit or Loss | Assets and Liabilities | Cash on Hand |
Now, let’s discuss how the business reports its financial performance.
The organization creates three types of financial statements. Each provides a different perspective of the financial health and management of the organization. When used together, they provide a complete picture of the company’s financial performance.
Like all the other aspects of finance, the time period of the financial reports are extremely important.
Whether a financial transaction is included on a report is based on the timing of that transaction. And naturally including or excluding transactions can have a significant impact on numbers.
What is an Earnings Statement?

The first report to discuss is the earnings statement, which is sometimes called the net income statement or the profit and loss statement (P&L). The earnings statement focuses on profits that have been earned.
As I already mentioned, there is a time period for each financial report. The earnings statement covers a specified period, such as a quarter or a year. All the transactions that happened in that period are shown on that report.
The earnings statement has three sections.
The first section shows all the money that came in through sales of products or services. Adding up all of those transactions gives us the total revenue.
The next section shows all the money spent to run the business during that period. This includes several cost categories.
There’s the money spent making the products and services that were sold during that period, and there’s the money spent in all the departments running the business.
We discussed both of these back when we talked about the product unit cost and department budgets. Also, looking back to previous discussions, we can mention that CAPEX is not shown as a business expense but the depreciation charge from CAPEX in previous years will be included as a business expense.
The earnings statement will then combine the first section and the second section of the report.
The cost of running the business is subtracted from the total revenue to determine the Operating Profit for the company.
Now, for the third section of the report.
Based on the level of Operating Profit, the corporate income taxes are computed, and the final result is the money the organization made, which is called Earnings, Net Income, or Profit.
To use a metaphor, think of the earnings statement as your personal tax return.
First, you show all the money you made from wages and investments – your revenue.
Then you can take deductions – an allowance for your expenses.
This leaves you with what the government considers to be your Operating Profit, so they apply taxes to it. Whatever is left after taxes is your Earnings.
What is a Balance Sheet?
The balance sheet approaches time differently than the earnings statement. The Balance Sheet focuses on the net worth of the organization.
Instead of a specified period, the balance sheet is for a specific date. Everything that has happened before that date is included. Nothing after that date is included.
The balance sheet divides all transactions that have occurred into one of three categories:
- Assets: the sum of transactions that added value to the organization.
- Liabilities: the sum of the amounts of money owed to other entities.
- Equity: the value of the organization that is allocated to the owners. This is the difference between the assets and the liabilities.
The Balance Sheet gets its name because it’s often pictured with assets on one side of a scale and liabilities and equity on the other side. And the scale is always balanced.
An increase in assets either means an increase in liabilities or an increase in equity.
A decrease in assets either means a decrease in liabilities or a decrease in equity.
Let me give you a simple example.
One of the assets for an organization is cash. If the business borrows money from the bank, they get more cash on the asset side of the scale. But they now have a loan to pay back on the liability side of the scale.
When the organization pays off the loan, the assets are reduced by the amount of cash sent to the bank. But the liabilities are also reduced because the loan is paid off.
The assets side of the scale is further divided into Current Assets and Fixed Assets categories.
There are precise financial definitions for these categories, but I will just discuss them in generalities that are relevant to an operating manager.
Current assets are cash or items that can quickly become cash.
These include any securities, such as stocks or bonds, since those could be sold on a financial exchange to generate cash. They also include money owed to the organization by customers who have not yet paid for products and services that have been delivered (also known as Receivables). Inventory is also a current asset since it can be sold to a customer.
Fixed assets take us back to the earlier discussion about CAPEX.
I hope you recall that CAPEX spending will always create a fixed asset. However, on the balance sheet that asset will change its value. Each year the asset value is reduced by the amount of depreciation on that asset.
A fully depreciated asset will be listed on the balance sheet with a value of $0. However, that asset may still be in use and providing value to the organization.
Finance and market analysts use these asset categories to evaluate company performance. From an operating manager standpoint, we care about them because we manage them.
Liabilities are also divided into categories, known as Short-Term Liabilities and Long-Term Liabilities.
Short-Term Liabilities are anything due within one year. As an operations manager, the only short-term liabilities that you should be concerned with are the bills from vendors and suppliers, known as Payables.
All the other Liabilities – both short term and long term – are managed by the finance department. These are usually debt and bonds.
The Equity scale is also divided into two categories.
One category represents the Owner Investment, which is the money that owners and investors have put into the organization. Because of this payment, they usually own a share of the company and are called shareholders.
The other category is the Retained Earnings, which is money that the business made in profits, but did not give to the owners through shareholder distributions. This reflects the reinvestment back into the business from the profits that the business has earned.
As an operating manager, I never get involved in the equity portion of the balance sheet. My job is to manage the assets well. Finance handles the rest.
Again, here’s a personal metaphor.
The balance sheet is similar to your personal Net Worth Statement.
The assets are what you own, like your house or your car, and what you have in your bank and investment accounts.
The liabilities are your outstanding bills and loans, such as your mortgage or student loans. Finally, whatever is left is your equity – your Net Worth.
What is a Cash Flow Statement?

The final financial report is the Cash Flow Statement, which is how we track cash in the business. The Cash Flow Statement focuses on how much ready cash is available.
Like the earnings statement, this represents what has happened over a period of time, such as a quarter or year.
This report focuses on how much money is in each of the different business accounts, and it’s divided into three categories.
1. Cash from Operating Activities
The first category is Cash from Operating Activities.
This frequently starts with the earnings / net income / profit amount that is found on the earnings statement.
The next element of this section is based on our discussion about CAPEX and depreciation.
Recall that there is an expense charge for depreciation in the earnings statement. However, there is no money actually spent on depreciation.
Remember, we spent the money when we spent the CAPEX.
We just record that spending on the earnings statement using depreciation. No cash flows when a depreciation charge is recorded.
Now, we started this report with the earnings from the earnings statement. But that value was based upon treating depreciation as a real expense. So, we need to add back the depreciation in this report if we want it to show real cash flow.
The rest of the entries come from the balance sheet.
To do this, we need two balance sheets.
The cash flow statement is for a period of time, so we need the balance sheet at the beginning of the period and the end of the period.
With these, finance calculates cash flow based on changes in the amounts of the current assets and the payables in the liabilities category.
These changes reflect business efficiency. If the business is well-run, the changes will be positive. If the business is ill-run, the numbers will be negative.
Based on the changes that occurred during the period, we’ve either unlocked cash and made it available or used cash to run the business. Usually, this is a positive number because operations is making money.
2. Cash from Investing Activities
The next category is cash from investing activities.
Cash from investing activities represents the money that is spent acquiring or selling off fixed assets for the organization.
Recall that we have eliminated depreciation from the Cash from Operating Activities category. We’ll now account for the cost of purchasing the fixed asset in this category. This is where we show all the CAPEX that is spent to create assets.
So just to be clear: The CAPEX is shown here when it is spent. That is why we don’t include depreciation. If we did, we would double count the cost of purchasing the asset.
Normally, this category is a negative number. The organization is investing in the creation or improvement of assets, which requires cash.
3. Cash from Financing Activities
Finance handles this category. It represents the money from banks and investors. It’s positive when the organization borrows money because there is more cash available. It’s negative when loans are paid off, or distributions are paid to investors because there is less available cash.
An important point to check when considering the financial health of a business is whether the Cash from Operating Activities is sufficient to cover the Cash from Investing Activities.
When it isn’t, the organization finds that it must borrow money to maintain operations and investments.
Once again, let’s get personal.
Think of this category as your personal checking account. When you receive your paycheck or sell an asset, money goes into the checking account. You use that money to pay your regular bills.
Sometimes you buy new assets, like a house or a car.
Often, you must first borrow the money from the bank to buy the new asset.
Then, over time, you use the money you make from your paycheck to pay down the debt while paying your regular operating expenses.
The Cash Flow Statement adds up the cash from operating activities, investing activities, and financing activities.
The total number is often the best financial report for understanding the ongoing financial health of an organization. It shows whether the business is making money or is running out of cash.
An operating manager’s glossary of financial terms, ratios, and metrics

We will close this overview with a list of standard financial terms that you as an operating manager or department manager should recognize and understand. Most of these terms have already been discussed.
These definitions explain what these terms mean to you as an operating manager. They are not the formal accounting definition that would be used by a CPA. But we believe they’re more practical from a day-to-day operational standpoint.
- Earnings, Profit, Net Income
- The amount of money that an organization earned during a time period based upon the sales of products and services and all the costs of running the business including financing and taxes.
- Operating Profit
- The amount of money that an organization earned during a time period based upon the sales of products and services and the operating costs of running the business.
- Gross Profit
- The amount of money that an organization earned during a time period based upon the sale of products and services and the cost to produce those same products and services.
- Current Assets
- Cash or the value of accounts that will quickly convert to cash based upon sales and collections.
- Fixed Assets
- The value of land, buildings, and equipment that are used to run the business – less any accumulated depreciation of those assets.
- CAPEX – Capital Expenditures
- The value of the money spent during a time period acquiring fixed assets. These are treated as Cash from Investing Activities on the Cash Flow Statement and causes an increase in Fixed Assets on the Balance Sheet. There is no impact on the Earnings Statement from CAPEX.
- OPEX – Operating Expenditures
- The value of the money spent during a time period used to run the business. This includes the cost of making products and services and the costs of running the various business departments.
- Depreciation
- A portion of the original cost of a fixed asset that is allocated to a particular time period. This allocation is determined by a depreciation schedule created by finance that considers the type of asset and the expected lifetime of the asset. Depreciation is treated as an operating expense on the Earnings Statement but is subtracted from the Cash from Operating Activities on the Cash Flow Statement. The Depreciation reduces the total value of the Fixed Assets on the Balance Sheet.
- Budget
- This is a final plan for spending for a business, department or project. It represents management’s intent and is used when measuring variance.
- Variance
- This is the difference between the actual amount of money spent on an activity within a time period as compared to the planned amount of spending recorded in the budget. Variance can be either positive or negative.
- Forecast
- This is the expected final value of an account at the end of a time period, or in the case of a project, at the end of the project.
- Raw Material Costs
- This is the cost of the materials used in products or services that are sold to customers.
- Direct Labor Costs
- This is the cost of the personnel expenses required to fabricate and assemble a product or perform a billable service to a customer.
- Indirect Costs
- This is the cost of providing support to the manufacturing operation during the fabrication and assembly of products to be sold. This only applies to costs that directly support the production line.
- Product Unit Cost
- The cost of Raw Material, Direct Labor and Indirect costs associated with making a single product or providing a single service to a customer.
- ROI – Return on Investment
- This is a calculation that compares the cost of an investment to the benefit from the investment and is used to determine whether the money should be spent on the investment.
- Payback Period
- An ROI technique that determines the time needed for the total benefit that has been realized to equal the investment cost of a project.
- Breakeven Point
- An ROI technique that determines how many units of a product or service must be sold to accumulate enough Gross Profit to offset the cost of the investment of a project.
- NPV – Net Present Value
- An ROI technique that determines the value to the business of an investment by considering all the costs and all the benefits over some specified time period. The future costs and benefits are discounted into “today’s” dollars and account for inflation / deflation / cost of money.
- IRR – Internal Rate of Return
- An ROI technique that determines an equivalent interest rate that would yield a similar amount of benefit over a specified time period that an investment is expected to yield.