
LMS reporting is the ability of your learning management system (LMS) to offer specific, tabular, graphical, or other visual representations of the activity taking place within your learning platform. The best training tracking LMS software offers valuable insights into L&D challenges and answers questions like:
- How well are teams completing the courses assigned to them?
- Are learners sufficiently motivated to participate in the learning process?
- How effective are our training materials in building the skills required to keep our business competitive?
- Are learning outcomes in line with our strategic goals?
Learning management systems are more than just platforms for course delivery. They provide visibility into how your people engage with instructional materials and make it clear whether training objectives are consistently being met. LMS reporting and analytics can easily make or break whether you can measure training return on investment (ROI).
If you are experiencing subpar training outcomes, simply implementing an LMS will not improve results. You should be leveraging data and analytics to drive performance. The data uncovered by LMS reports and analytics can enable you to isolate and control the crucial metrics for streamlining your workplace training strategy, boosting your ROI, and driving a positive shift in learning outcomes and experiences.
7 Essential LMS reporting metrics
Ideally, LMS reporting looks into every player and point of interaction in the learning process. They help assess the performance of your training initiatives by monitoring learner progress, course relevance or effectiveness, and other variables.
As an L&D leader, your task is to cut through the noise by generating insightful reports and leveraging key metrics that impact your teams.
A good LMS tracks the following key metrics:
1. Completion rate
The percentage of learners who successfully finish a course, workshop, learning track, or training program. You can find this metric by dividing the number of employees who finish a course by the number of initial participants (or enrollees/assignees).
In general, a high completion rate indicates high learner engagement and commitment. It may also imply that a course or training program resonates with its target audience (i.e., relevance).
On the other hand, low completion rates may signal issues such as poor learner experience, unclear training objectives, learner-course mismatch, or ineffective/inappropriate course design.
2. Total time spent learning
The amount of time a learner spends on courses and other training-related activities such as discussion forums, homework, and collaborative tasks.
This metric may reflect learners’ commitment and interest in taking a lesson or the attractiveness of a specific course.
Analyzing total time spent can help you identify bottlenecks in the learning process and improve learner engagement by fine-tuning course design, teaching approach, lesson format, or the duration of individual lessons.
3. Assessment score
The measured performance of a learner on quizzes, exams, exercises, challenges, and other assessment tests. Assessment scores may evaluate the learner’s focus, aptitude, or cognitive ability as well as the quality and effectiveness of training materials.
This metric provides insights into learners’ understanding and retention of course content and helps identify areas where learners may need reinforcement. High scores indicate successful learning outcomes while low scores should prompt remedial action.
4. Learner satisfaction and feedback
The qualitative and quantitative evaluation learners provide regarding a specific lesson, course, instructor, or training program. High scores indicate that learners are satisfied with their training and have had a good learning journey.
Learner feedback provides valuable information on course effectiveness, content relevance, and learning experience. It helps L&D managers and course instructors to identify and address weaknesses in the training content and/or its delivery. To extract this data, you need to integrate feedback forms and rating sheets at the end of every lesson or training activity.
5. Learner progress
The metric that indicates how far a learner has advanced in a course or training program. Learner progress is a combination of basic metrics such as the number of lessons taken, modules completed, skills acquired, badges earned (gamification), and other milestones achieved.
Monitoring learner progress helps your L&D team identify learners who might be struggling in some areas and need additional support. It also helps assess the learning pace, ensuring that learners are on track and on schedule to meet training goals. By examining progress data, you can tailor content, pacing, learning path, and remediation for each specific learner.
6. Engagement level
Engagement level assesses how involved and committed a learner is with assigned courses, training programs, and associated activities. It combines basic metrics such as time spent learning, course completion rate, attendance rate, learner feedback score, and participation in learning activities (e.g., discussion groups, download of supplementary materials, assessment test scores, team challenges, and online forums).
A high engagement level correlates with better learning outcomes because engaged learners tend to understand lessons faster and apply those lessons more effectively.
7. Knowledge retention
This metric indicates how well a learner understands and retains the concepts or skills learned through the training program.
Primarily assessed via exams and follow-up exercises, knowledge retention can also be evaluated through the application of lessons learned in real-world scenarios. Effective training should result in long-term knowledge retention. Reinforcement measures should be implemented if learners forget crucial information shortly after training. This can be achieved through on-the-job application tracking and post-training assessments.
What are essential LMS reporting features?
Not all learning platforms offer the same depth of reporting. Some limit you to basic completion percentages, while others give you granular, actionable data across every part of the learning process. Here's what to look for when evaluating an LMS's reporting capabilities:
1. Real-time dashboards
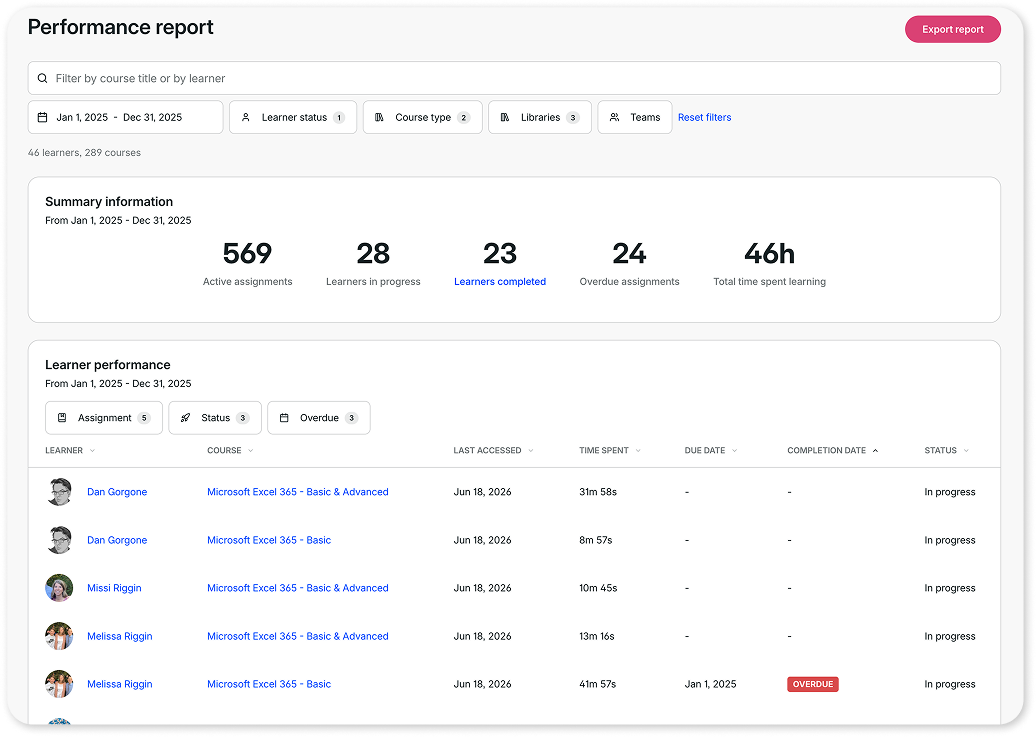
Your LMS should surface key metrics the moment they change, not on a delay. A strong reporting dashboard gives you an at-a-glance view of completion rates, engagement levels, and overdue assignments without requiring you to run a report manually. Look for platforms that update data continuously rather than in batches.
2. Customizable and segmented reports
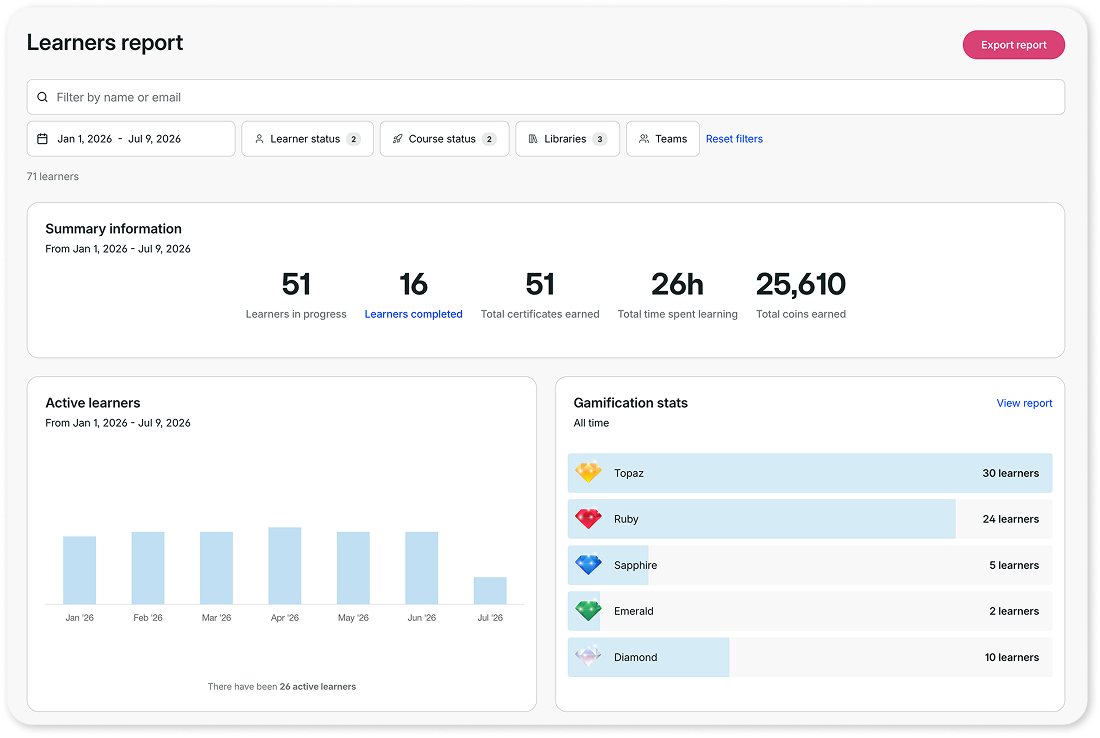
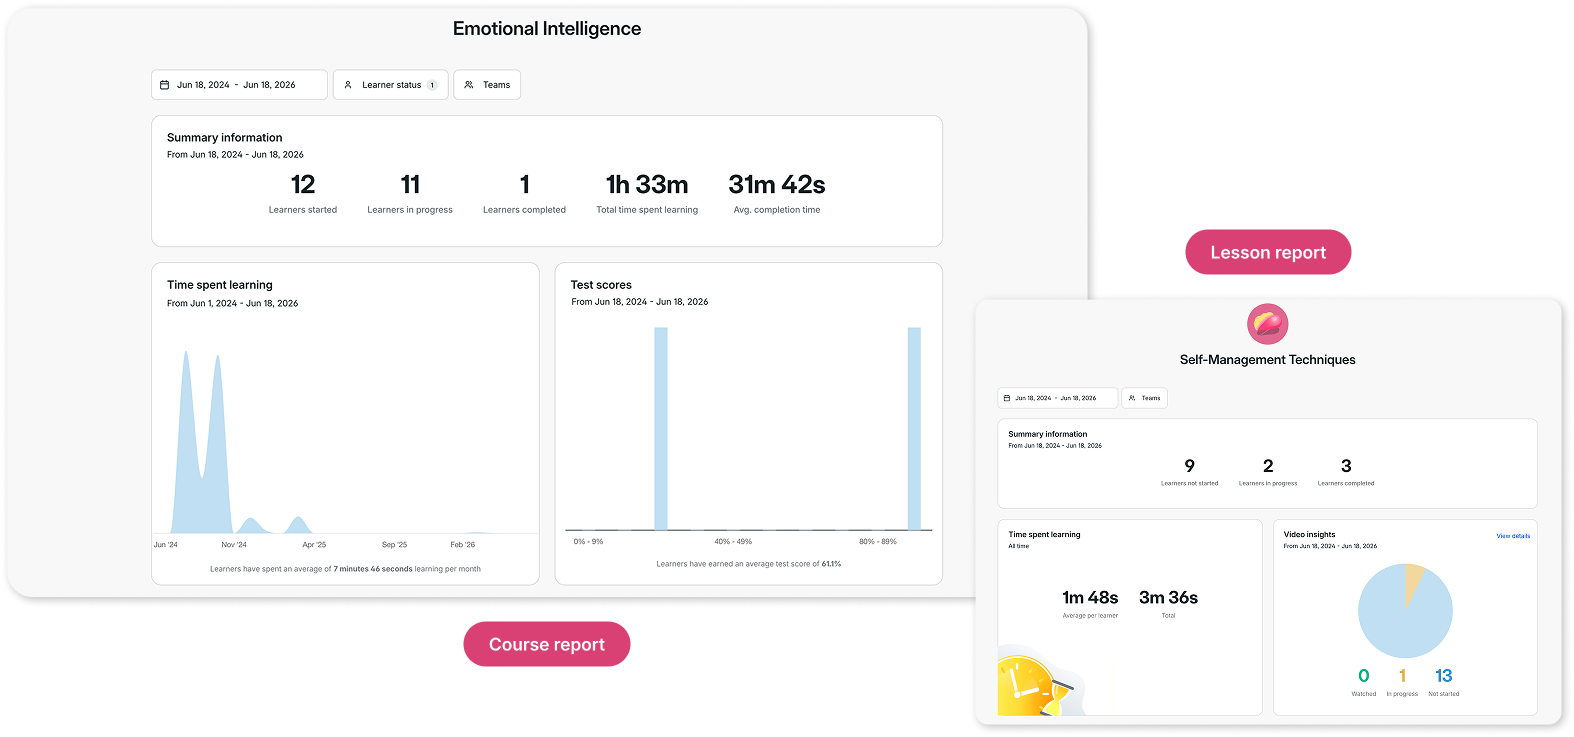
Beyond standard performance summaries, look for an LMS that lets you generate reports by team, department, course, or individual learner. The GoSkills LMS, for example, offers performance overview, learners, courses, and teams reports — each surfacing a different slice of the same underlying data so you can isolate exactly where a problem is occurring.
3. Drill-down and filtering capabilities
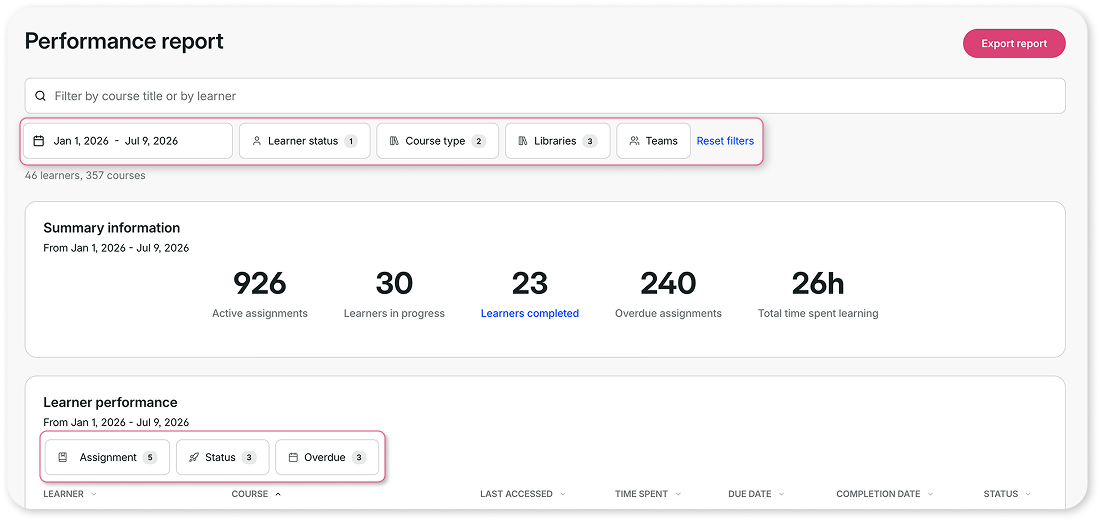
A good reporting tool does more than report on the facts, such as falling completion rates. It allows you to filter and drill into the data to find out why. Look for the ability to filter by date range, course, team, or learner status, and to click into a summary metric to see the individual records behind it.
4. Exportable and shareable reports
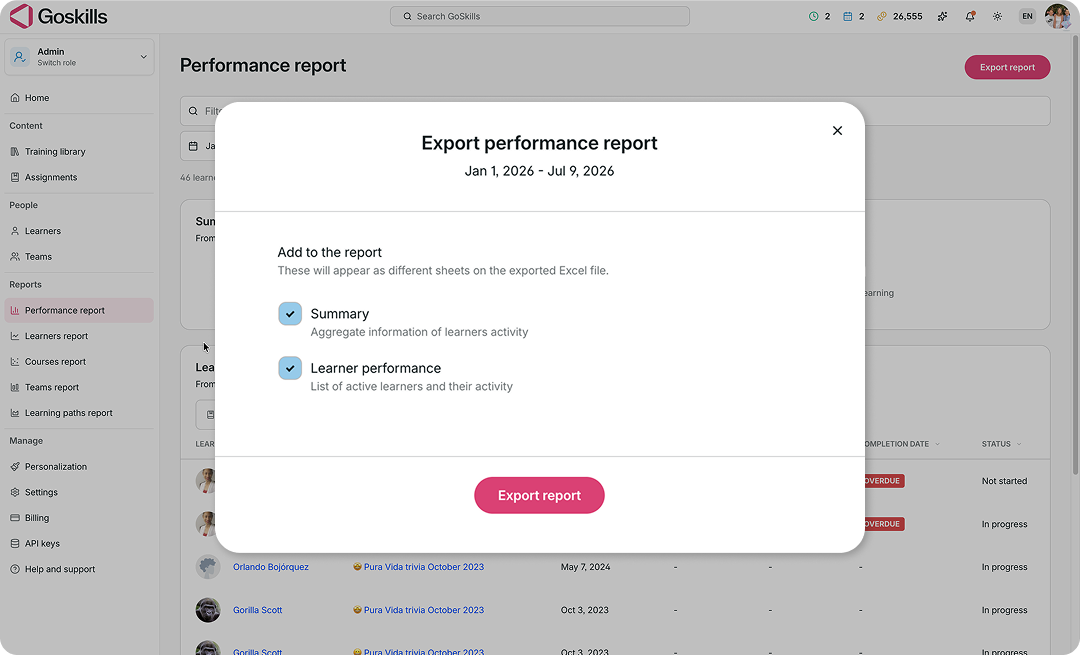
Whether you need to present data to leadership or feed it into a separate BI tool, your LMS should let you export reports in common formats (CSV, PDF, or Excel) so you can share the "big picture" as well as the finer details with stakeholders.
5. Compliance and certification tracking
If your organization has mandatory training requirements, your LMS should be able to report specifically on compliance status — who's certified, who's overdue, and when certifications expire — so you can flag risk before it becomes a problem.
6. Benchmarking and trend analysis
Look for reporting tools that let you compare performance over time (this quarter vs. last) or across cohorts (one team vs. another), rather than just showing a static snapshot. Trend data is what turns reporting from a record-keeping exercise into a tool for improvement.
7. Role-based report access
Not everyone needs to see everything. Managers may only need visibility into their own team's data, while L&D leaders need the full picture. Look for an LMS that lets you control who sees which reports.
What LMS reporting & analytics should enable you to do
Now we’re getting to the good stuff. Here’s how you can use LMS reporting to fix problems in your learning and development program:
Identify training gaps
Start by reviewing standard reports to pinpoint training gaps. These gaps highlight areas where your workforce, instructors, or course designers may need additional support. For instance, in the GoSkills LMS dashboard, you can access various reports such as performance overview, learners report, courses report, and teams report. Each report provides data to identify specific areas for improvement.
Monitor course engagement
Examine the dashboard to see how many members have started and completed their assigned courses. Check if everyone has viewed their assigned courses and identify any overdue assignments. Automated notifications can remind learners to read the course overview, begin lessons, pass assessment exams, and complete the course.
Revamp content based on feedback
Analyze learner feedback and performance to enhance your training materials and instructional methods. Regularly update and refresh your content to keep it engaging and current. Ask questions like: How many assigned courses have been completed? Which courses are completed quickly, and which ones drag on? Consider redesigning courses to break down lessons into manageable chunks, simplify exercises, and speed up completion.
Improve test scores with better instruction
Identify lessons with lower average test scores and explore better instructional approaches to help learners achieve higher scores. Adjust your courses to match the preferred learning styles of your employees, creating personalized learning paths that cater to individual needs, goals, and preferences. This approach keeps employees motivated, enhances knowledge retention, and accelerates course completion.
Track milestones and address pain points
Monitor which team members are achieving milestones faster and which need some encouragement. Reviewing feedback on the training process and materials can help identify pain points and improve the learning experience for everyone.
Align training with business goals
Ensure your training objectives align with business goals to measure training effectiveness and maximize your investments. A disconnect between your L&D program and business objectives can erode your team training ROI. Track the impact of your training efforts on key business metrics such as productivity, employee retention, sales, and customer satisfaction.
Why GoSkills for LMS reporting?
GoSkills is best for small and mid-sized teams that need clear, actionable reporting without complex setup. Rather than burying you in configuration options or requiring a dedicated analyst to make sense of the data, GoSkills LMS surfaces the reports that matter most: completion rates, team performance, and course engagement, right out of the box. Its performance overview, learners, courses, and teams reports are pre-built and ready to use from day one, so L&D teams can start identifying training gaps and tracking ROI immediately rather than spending weeks setting up custom dashboards.
This makes GoSkills a strong fit for SMBs that want reporting depth without the overhead of an enterprise-grade analytics suite. Busy administrators or L&D specialists get the metrics they need from their employee training software to make informed decisions, without needing a data team to interpret them.
Find the right LMS for your small business
Learn how to evaluate LMS options against the unique needs of your small or medium-sized business.
Best practices when using GoSkills LMS reports
Here are some tips on how to leverage the features of GoSkills LMS to drive learner engagement and propel your training program:
- Organize teams. Group your learners into teams based on their roles, departments, or proficiency levels.
- Assign courses with deadlines. Set completion dates for courses to keep learners on track.
- Automate notifications. Use automatic notifications for key events in the learning process to keep learners informed and engaged.
- Integrate feedback forms. Require instructors and course designers to include survey and feedback forms in addition to assessment exams for every lesson or activity.
- Utilize gamification features. Customize and deploy the platform’s gamification features to make learning more interactive and enjoyable.
- Celebrate milestones. Recognize learning milestones achieved by individuals and teams. Create and award custom certificates for course completions and other achievements.
- Implement daily streak challenges. Encourage consistency by implementing daily streak challenges.
- Foster friendly competition. Conduct friendly competitions among teams and individuals to motivate learners.
- Recommend courses. Encourage learners to explore courses recommended by the platform based on their current learning paths.
- Integrate learning with career development. Make structured learning a key part of your employees’ career development plans.
Strong data means continuous improvement
LMS reports provide real-time dynamic data, reflecting ongoing changes in learner behavior, course materials, lesson formats, and instructional approaches. As an L&D leader, your task is to cut through the noise by generating insightful reports and leveraging key metrics that impact your teams.
Make use of these LMS metrics to refine your workplace training program, upskill your workforce, and drive your business forward.