
Download your challenge data
Start working on the Excel challenge with these data worksheets
Welcome to Excel challenge #3!
This week's challenge is designed to test your knowledge of the Power Query concepts from the GoSkills Excel - Basic & Advanced course.
Everything you need to participate in the challenge can be found on this page. To take part:
- Watch the challenge video
- Read the instructions below the video
- Download the Excel worksheet you will use to complete the challenge tasks
- Put yourself to the test!
Want to chat about your approach and process with other Excel-heads? Join our new Slack channel to share your insights and questions with like-minded learners.
The Challenge
There are two Excel workbooks to download and use in this challenge.
Download your challenge data
Start working on the Excel challenge with these data worksheets
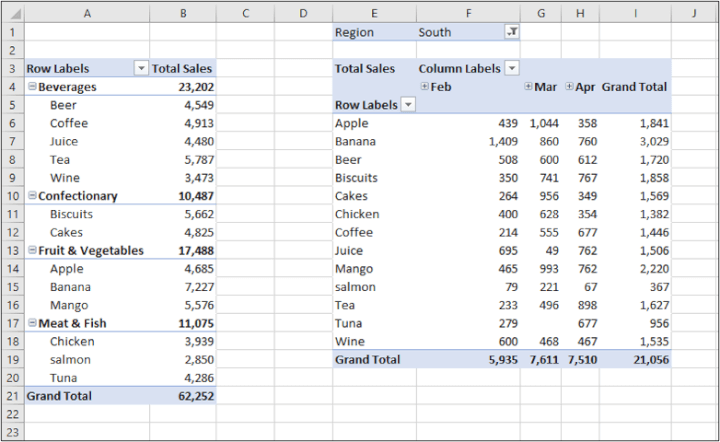
The sales-report.xlsx workbook is the one to work from. And the goal of this challenge is to create the following two Pivot Tables.
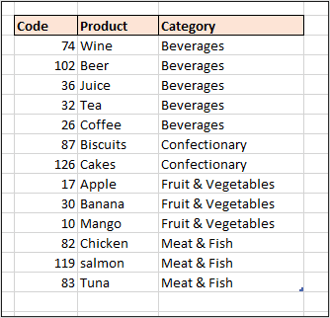
 In this workbook, there is only a table named ‘products’. This contains the product code, name, and category.
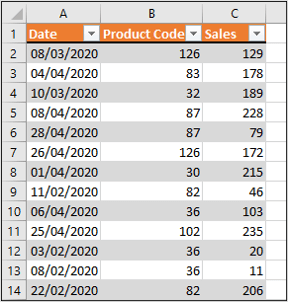
 In a workbook named sales-data.xlsx, there are three tables named North_Sales, South_Sales and East_Sales.
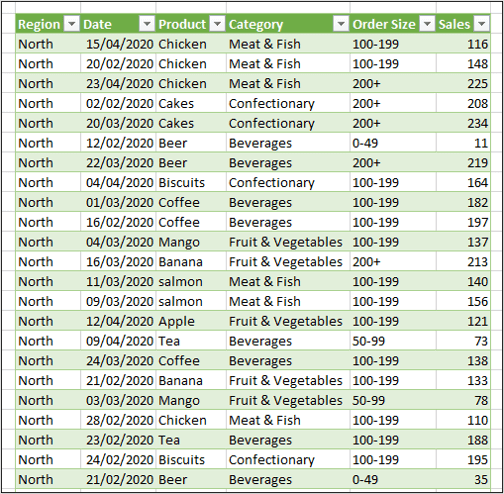
We need to import these three tables into sales-report.xlsx and stack them into one list. These are the only three tables we want from that workbook. Exclude everything else.
Here is a snapshot of one of those tables.
 We then need to combine the two tables to get the product ‘Name’ and ‘Category’ columns into the stacked sales table.
We also need to add a column with the region name (taken from the table name) and also a conditional column with the sales grouped into the following categories: 0-49, 50-99, 100-199 and 200+.
 Consider that additional sales tables may be added in the future, such as West_Sales, and the solution should continue to work with this new data when clicking Refresh.
The Pivot Tables can then be created from this sales table.
Make sure you have downloaded the sales-report.xlsx and sales-data.xlsx workbooks to take on the challenge.
Download your challenge data
Start working on the Excel challenge with these data worksheets
The Solution
We hope you´ll enjoy taking part in this challenge! Stay tuned to the GoSkills Excel Resource hub for more Excel challenges, and check out our range of Excel courses to further sharpen your skills.

Join the Excel conversation on Slack
Ask a question or join the conversation regarding Excel challenges on our Slack channel.
Join Slack channel