
The Analysis ToolPak is an Excel add-in that provides tools for complex data analysis. The ToolPak eliminates the need to know the detailed steps involved in executing certain calculations. And even if you do know these detailed steps, it’s obviously a time-saver. If you have statistical or engineering data which you’d like to analyze, you can use the Excel Data Analysis ToolPak to apply the technique of your choice to generate an output table that analyzes, simplifies, and/or summarizes that data.
In each case, you determine the appropriate statistical or engineering function for your data, select the tool from Excel’s ToolPak and the results will be displayed in an output table. Some tools generate both charts and output tables.
Below, you will learn how to access the statistical tools you already know and understand.
200+ Best Excel Shortcuts for PC and Mac
Download the shortcuts now!
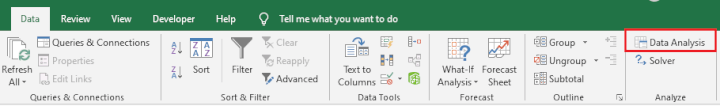
But, first things first: how do you access this add-in? If it’s already activated, you’ll see it under the Data tab within the Analyze group of commands.
 If it isn't activated, you can load it by doing the following.
How to load the Analysis ToolPak add-in (Windows)
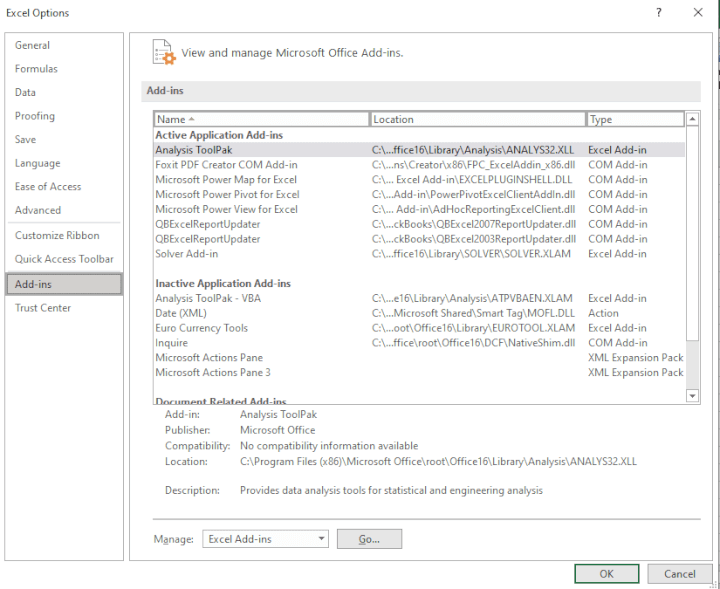
- Go to the File tab on the ribbon and click Options,
- Click the Add-Ins category on the left. (In Excel 2007, click the Microsoft Office Button, and then click Excel Options.)
- From the Manage drop-down list, select Excel Add-ins, then click Go.
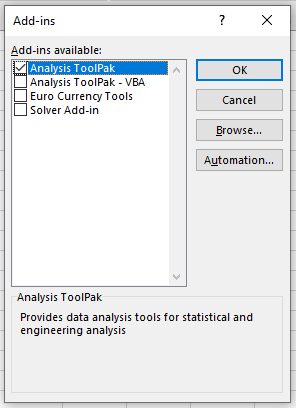
- In the Add-Ins dialog box, tick the Analysis ToolPak check box, then click OK.
Notes:
- If Analysis ToolPak is not shown as one of the Add-Ins available, click the Browse command to find it.
- If you get a message that the Analysis ToolPak is not currently installed on your computer, click Yes to install it.
How to load the Analysis ToolPak add-in (Mac)
- Go to the Tools menu, and then click Excel Add-ins.
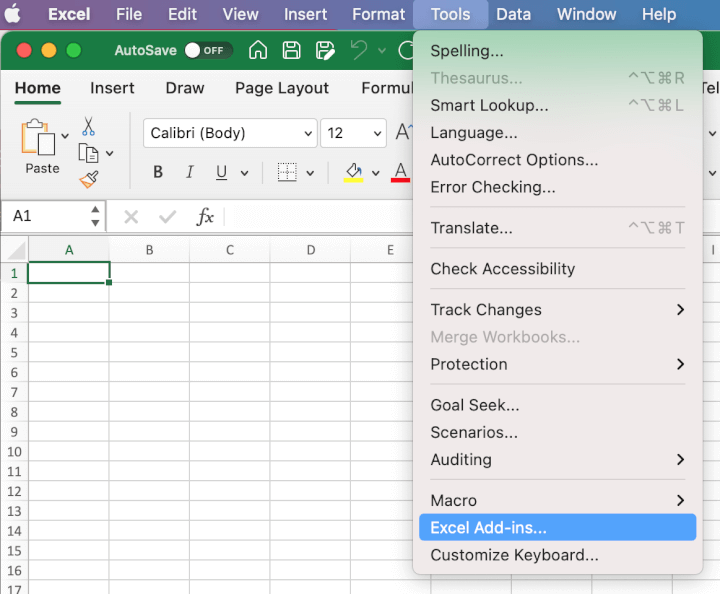
- In the Add-Ins Available dialog box, select the Analysis ToolPak check box, and then click OK.
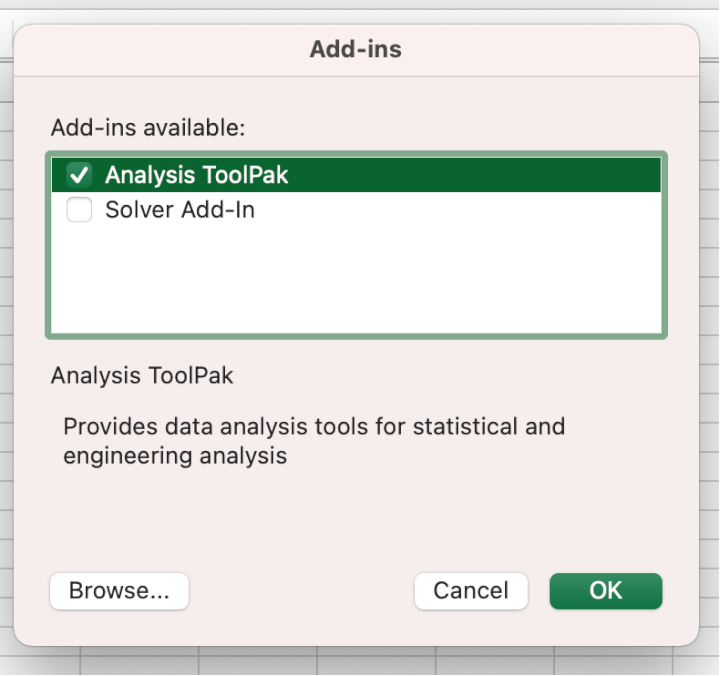
- If Analysis ToolPak is not shown in the Add-Ins available box, click the Browse command to find it.
Note:
If you get a message that the Analysis ToolPak is not currently installed on your computer, click Yes to install it. Then quit Excel and restart.
The command will now be displayed on the Ribbon. If you click on it, the Data Analysis window pops up, listing 19 analysis tools that are linked to functions designed to analyze data using various mathematical formulas.
You may notice that Excel takes slightly longer to open when the add-in is loaded. This is to be expected, as more resources are being used to run the application.
The tools currently available are:
- Anova (Single-Factor)
- Anova (Two-Factor With Replication)
- Anova (Two-Factor Without Replication)
- Correlation
- Covariance
- Descriptive Statistics
- Exponential Smoothing
- F-Test Two-Sample for Variances
- Fourier Analysis
- Histogram
- Moving Average
- Random Number Generation
- Rank and Percentile
- Regression
- Sampling
- t-Test: Paired Sample for Means
- t-Test: Two-Sample Assuming Equal Variances
- t-Test: Two-Sample Assuming Unequal Variances
- z-Test: Two Sample for Means
The purpose of each analytical tool is shown below.
|
Tool |
Description |
|---|---|
|
Anova (Analysis of Variance): Single Factor |
This tool determines if there is a relationship between two datasets by performing a simple analysis of variance. |
|
Anova (Analysis of Variance): Two Factor with Replication |
This tool determines if there is a relationship between two datasets by performing an analysis of variance when each data set has more than one observable data point. |
|
Anova (Analysis of Variance): Two-Factor without Replication |
This tool determines if there is a relationship between two data sets by performing an analysis of variance. There is only a single observable data point for each pair. |
|
Correlation |
Tells you how strongly two variables are related to each other. |
|
Covariance |
The Covariance analysis tool calculates the average of the product of deviations of values from the means of each data set. |
|
Descriptive Statistics |
Generates a report of univariate statistics for the selected data. Statistics generated include: Mean, Standard Error, Median, Mode, Standard Deviation, Sample Variance, Kurtosis, Skewness, Range, Minimum, Maximum, Sum, Count, Largest, Smallest and Confidence Level. |
|
Exponential Smoothing |
Smooths out irregularities (peaks and valleys) in data, to easily recognize trends . More recent data is weighted more heavily. |
|
F-Test Two Sample for Variances |
This analysis tool compares the variances between two groups of data. |
|
Fourier Analysis |
This tool solves problems in linear systems and analyzes periodic data by using the Fast Fourier Transform (FFT) method to transform data. The Fourier Analysis tool also supports inverse transformations, where the inverse of transformed data returns the original data. |
|
Histogram |
The Histogram analysis tool counts occurrences in each of several data bins. It calculates individual and cumulative frequencies for a cell range of data and data bins. The output is a table and column chart by the frequency of occurrences. |
|
Moving Average |
Calculates a moving average to allow you to smooth out a data series that contains peaks and outliers. Used for forecasting trends in sales, inventory, call volume, etc. |
|
Random Number Generation |
Creates a number of several types of random numbers including Uniform, Normal, Bernoulli, Poisson, Patterned and Discrete. More flexible than the RAND and RANDBETWEEN functions. |
|
Rank and Percentile |
Creates a table that ranks numbers from highest to lowest and provides a percentile value of each number relative to the other numbers within the data set. |
|
Regression |
Uses the function LINEST to analyze how a single dependent variable is affected by the values of one or more independent variables. Creates a table of statistics that result from least-squares regression. |
|
Sampling |
Samples a population randomly or periodically, as desired. |
|
t-Test: Paired Two Sample for Means |
Paired two-sample student's T-Test. Each Two-Sample t-Test analysis tool tests for equality of the population means that underlie each sample. The paired two-sample form of the t-Test is used when there is a natural pairing of observations in the samples — for example, when a sample group is tested twice, before and after an experiment. There is no assumption that the variances of both populations are equal. |
|
T-Test: Two Sample assuming equal Variances |
This analysis tool performs a two-sample student's t-Test. This t-Test form is based on the assumption that the two paired data sets came from distributions with the same variances. It is also known as a “homoscedastic t-Test”. This t-Test can be used to determine if the two samples are likely to have come from distributions with equal population means. |
|
T-Test: Two Sample assuming unequal Variances |
This t-Test form assumes that the two datasets are from distributions where the variances are unequal. This is called a “heteroscedastic t-Test”. |
|
Z-Test: Two Sample for Means |
The Two Sample for Means analysis tool performs a two-sample z-Test for means with known variances. This analysis tool is used to test the null hypothesis that there is no difference between two population means against either one-sided or two-sided alternative hypotheses. If mean variances are not known, use the Z.TEST function instead. |
For a more detailed explanation of the type of analysis each method provides, check out this resource.
Conclusion
Significantly, the data analysis functions can be used on only one worksheet at a time. If you do a data analysis on grouped worksheets, the results will appear on the first worksheet and the remaining worksheets will display empty formatted tables. To analyze data on the remaining worksheets, recalculate the analysis tool for each worksheet one by one.
If you’re ready to let someone else help you with some of the heavy lifting in your engineering, project management and statistical data analysis, check out Excel’s Data Analysis ToolPak.