
Variance is a number that gives a general idea of the dispersion of a dataset. A variance of 0 means there is no variability, that is, all the numbers in the dataset are the same. The larger the number, the more dispersed the values are. Variance tells us how much the individual members of the dataset differ from the mean.
Variance formula Excel — Get the practice file!
Download your free variance practice file!
Use this free Excel variance file to practice along with the tutorial.
Population variance vs. sample variance
There are two types of variance calculations: population variance and sample variance.
- Population variance means that each member of the population is shown in the dataset.
- Sample variance means that the data was extracted from a sample of the population.
Manual calculation of variance
Population variance
To help us understand how it works, let’s look at an example and manually calculate the variance. The average scores of all nine schools in the city’s high school district are shown below.
To determine the variance, we’ll need to calculate three numbers first — the simple average (arithmetic mean), the difference between each class’s average score and the arithmetic mean, and the square of each difference.
Finally, we find the sum of the squared differences, divided by the number of values within the dataset.
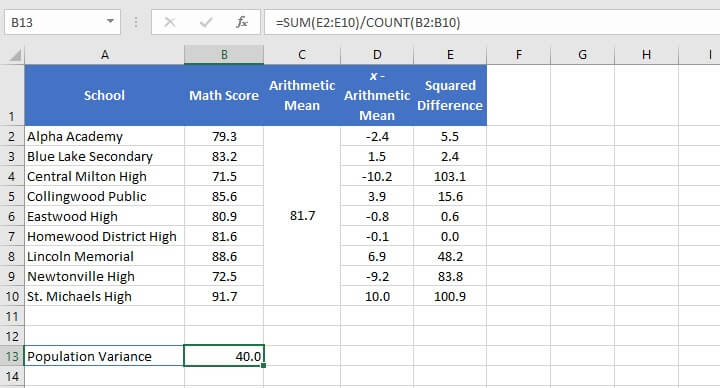 The population variance is 40.
In this example, this is considered a population dataset since this is the only school district we are interested in, and we will not use this data to interpret anything about a larger population.
Sample variance
If, however, we randomly selected four schools from within the school district to make an assumption or prediction about the district’s math performance, this would be a sample variance. This is calculated slightly differently.
The reason is that since we do not actually have the information needed about all the schools that we’re interested in, we’ll have to account for the unknown in our calculation.
Whereas the example above uses the number of values within the dataset (4) as the denominator, when calculating sample variance, we would subtract 1 from the number of values and use that as the denominator.
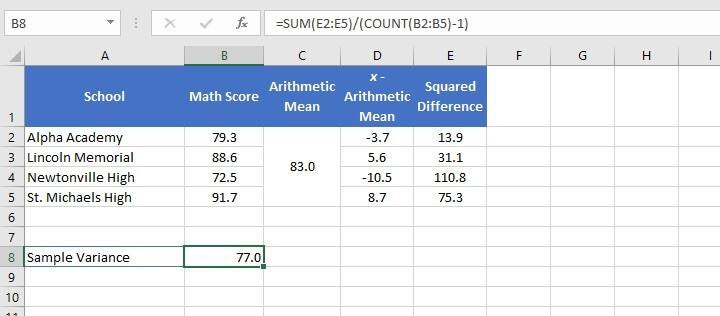 Using 3 as the denominator, we have determined that the sample variance is 77. The sample variance will always be greater than the population variance when they are calculated for the same dataset.
This is because the formula for the sample variance has to take into account the possibility of there being more variation in the true population than has been measured in the sample.
Excel variance functions
Now that we know what is happening in the background of a variance calculation, let’s see how Excel simplifies this entire business.
Excel has six functions to calculate variance. The function you choose is dependent on the version of Excel you’re using, whether you want to calculate population variance or sample variance, and how you want Excel to handle text and logical values.
A summary of the six functions is shown below.
| Function name | Data type | Data handling | Excel version |
|---|---|---|---|
| VAR | Sample variance | Ignores logical values and text | 2000 onward |
| VARP | Population variance | Ignores logical values and text | 2000 onward |
| VAR.S | Sample variance | Ignores logical values and text | 2010 onward |
| VAR.P | Population variance | Ignores logical values and text | 2010 onward |
| VARA | Sample variance | Text and logical values evaluated | 2010 onward |
| VARPA | Population variance | Text and logical values evaluated | 2010 onward |
In all cases, empty cells are ignored.
Functions that evaluate text and logical values handle them as follows:
- Text is given a value of 0.
- TRUE is evaluated as 1.
- FALSE is evaluated as 0.
Unless you only have access to the older versions of Excel, it is recommended that you use the newer functions, as they offer greater flexibility in data handling and it is uncertain how long Microsoft will continue to support the older versions.
Return value
All six functions follow the same syntax. The general format is:
=FUNCTION(value1, [value2],...)In each case, the formula accepts up to 255 arguments with only one argument being required. Arguments may be entered as a cell reference, a range, or as explicit values typed directly into the formula. The return value is a single number.
Practical applications of sample and population variance
Sample variance
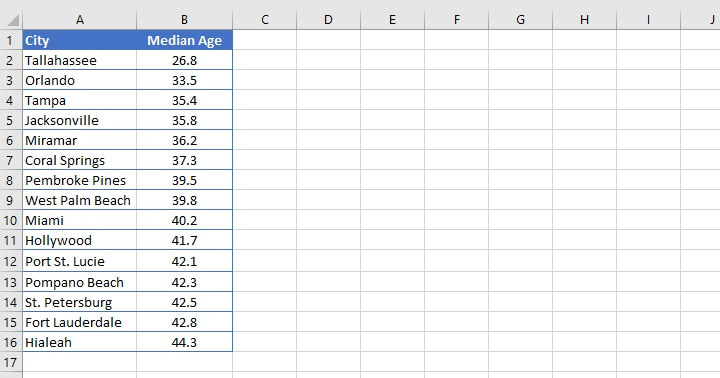
In the following example, the median ages of residents of fifteen cities in Florida have been listed. Values in the dataset are based on surveys and are therefore only a sample of the population.
 We would therefore choose between the VAR.S and the VARA functions to get the sample variance. VAR.S may be more appropriate in this instance.
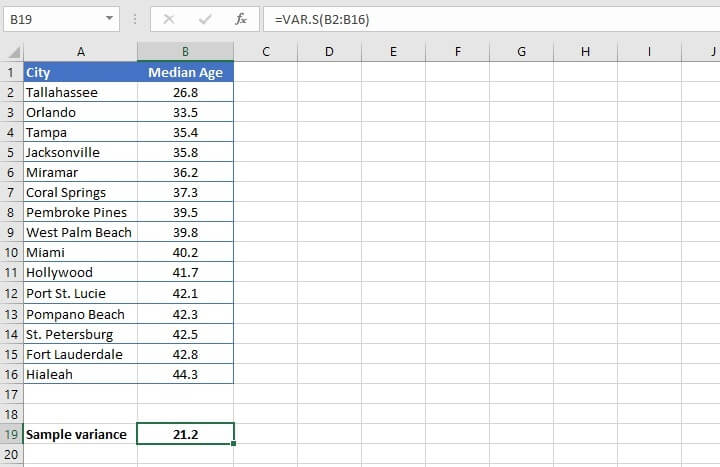 The variance of this sample’s age is 21.2. On its own, this figure is difficult to interpret. What exactly does 21.2 as a sample variance mean?
Variance vs standard deviation
If we recall, the calculation of variance is based on squared values. Therefore, if we find the square root of the variance, then we’ll arrive at the standard deviation, where the units are the same as the original dataset.
In the above example, the standard deviation is 4.6. Standard deviation is easier to understand because it tells a story of the degree to which data can vary from the mean of the dataset. This is saying that the ages within the range lie along a 4.6-year spectrum from the mean of the sample.
This also helps to give us an idea of whether there are any outliers in our sample which may be skewing other measurements, like the mean.
So, yes, the standard deviation figure is more useful, but we need to understand variance before we can understand standard deviation.
Population variance
As mentioned before, population variance is used when we are using all the data within a sample, so the margin of error is lower. For example, a business may have sales data for all years they have been in business, and want to calculate the variance using this data.
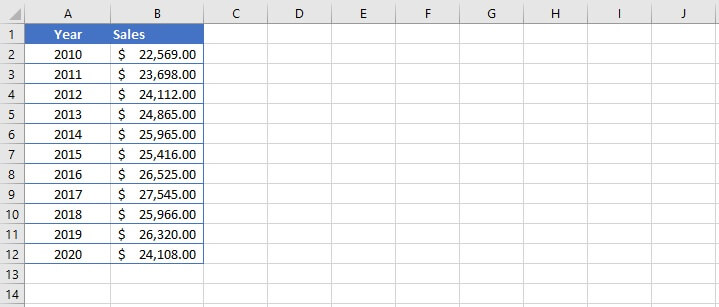 If the company has been in business since 2010, then all the data is included in the above dataset. In this case, VAR.P is used.
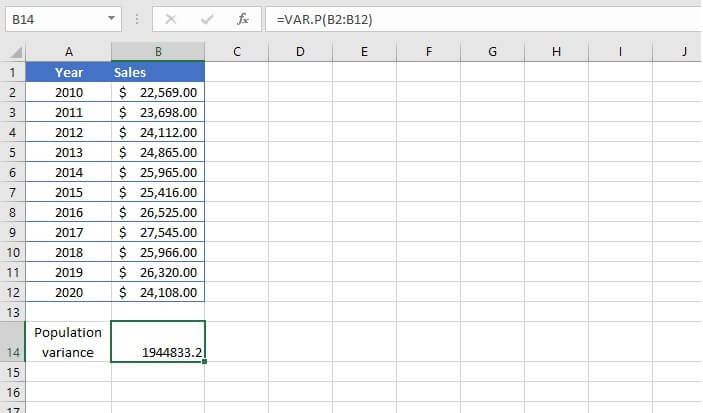 As with the previous example, finding the square root (standard deviation) of the variance is likely to give a value that is more meaningful in interpreting the distribution of the dataset.
Comparing all six variance functions
To compare how each of the six Excel functions returns different results, let’s go back to the earlier example of grades from a high school district where we manually calculated the variance. An additional row of data (A11:B11) was added to show how each function treats text values.
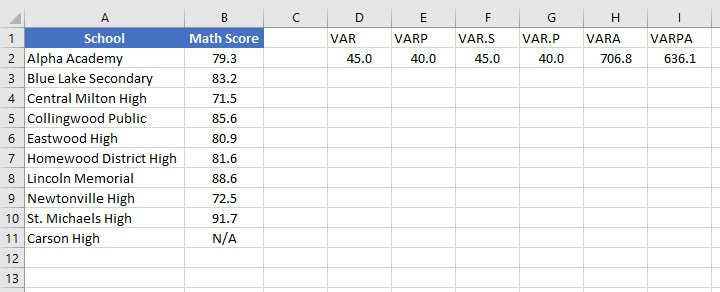 This side-by-side comparison nicely illustrates the difference in results, which can further help to inform which function we choose in each setting.
The older functions VAR and VARP are most readily comparable to VAR.S and VAR.P respectively, so the latter functions can be considered the replacements of the former.
VARA and VARPA returned results that are vastly different from the other functions due to the presence of the text value in cell B7. In each case, Excel assigned a value of 0 to the text and used that value when calculating each variance. If there are no text or logical values, VARA will return the same result as VAR.S, and VARPA will return the same result as VAR.P.
Reasons for using VARA may include:
- Absent data which would normally be included, and would constitute valid data if included.
- Not knowing why certain data is missing.
A researcher may choose to use a function that ignores text and logical values if it is known that the text value does not indicate missing data.
Learn more
Now that we’ve broken this down for you, are you ready to tackle some more statistical Excel functions? Come browse our resources and course library to get started!