
This article will define standard deviation and explain how to use the standard deviation formula in Excel.
If you’re already a statistician, you’ll know what standard deviation is and how it is used. If you’ve heard the term but weren’t sure what it meant, you’ll be surprised at how much of a story it tells.
Definition
Standard deviation: measures how much variance there is in a set of numbers compared to the average (mean) of those set of numbers.
It is found by calculating the square root of the variance of a dataset. Since standard deviation is measured in the same units as the dataset itself, it is usually easier to interpret than variance.
Download your free standard deviation practice file!
Use this free Excel standard deviation file to practice along with the tutorial.
Example
To help us understand this concept, observe the datasets below:
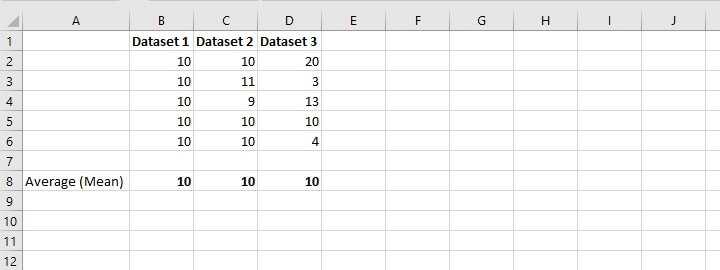 Though the mean of each dataset is the same (10), the values within each dataset range from uniformed in Dataset 1, to similar in Dataset 2, to widely dispersed in Dataset 3.
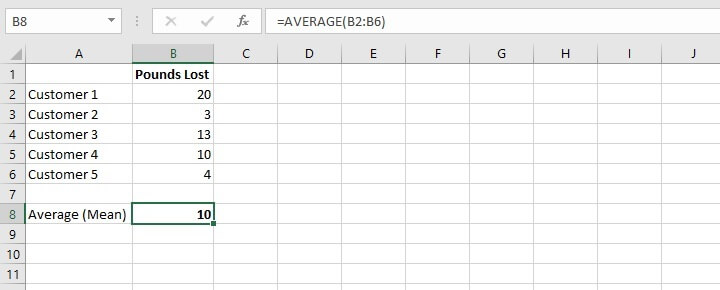
If a weight loss product advertised that their customers lost an average of 10 pounds, the actual data used to arrive at that average may be either quite uniformed or rather dispersed, and they could still arrive at an average loss of 10 pounds. Of course, the hope is that you will assume that all members of the dataset are a little more or little less than 10 since the mean does not account for widespread variation and outliers.
Standard deviation is a number that tells you how far numbers in a dataset are from their mean. For this reason, statisticians often rely on standard deviation to get a truer picture of the uniformity (or non-uniformity) of points in a dataset.
Population vs sample
There are two types of standard deviation: population and sample. We use the term ‘population’ when data is available for all the members of a group, and the data is shown in the dataset.
On the other hand, the term ‘sample’ is used when data from some members of a population is used to make an inference about the larger population.
The sample standard deviation will always be greater than the population standard deviation when they are calculated for the same dataset. This is because the formula for the sample standard deviation has to take into account that there is a possibility of more variation in the true population than what has been measured in the sample.
How to calculate standard deviation manually
A behind-the-scenes understanding of how standard deviation is calculated is important to understanding its value. Let’s determine the standard deviation of the following dataset:
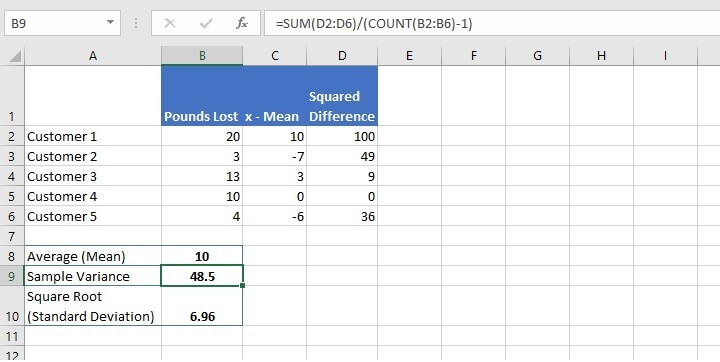
 For Dataset 3 above, we can determine standard deviation by calculating the following numbers first:
- The difference between each value and the arithmetic mean.
- The square of each difference.
- Variance:
- If this is a population dataset, we would then find the sum of the squared differences, divided by the number of values within the dataset.
- If this is a sample dataset, we would divide by the number of values within the dataset less 1 in order to account for the possible impact of the unknown values of data.
- Find the square root of the variance (step 3). This is standard deviation.
Standard deviation formula in Excel
You will be relieved to know that Excel eliminates the manual work by offering not one, but six functions to calculate standard deviation. The option you choose is dependent on whether you want to calculate population standard deviation or sample standard deviation, how you want Excel to handle text and logical values, and the version of Excel you’re using.
A summary of the six functions is shown below.
| Function name | Data type | Data handling | Excel version |
|---|---|---|---|
| STDEV | Sample standard deviation | Ignores logical values and text | 2003 onward |
| STDEVP | Population standard deviation | Ignores logical values and text | 2003 onward |
| STDEV.S | Sample standard deviation | Ignores logical values and text | 2010 onward |
| STDEV.P | Population standard deviation | Ignores logical values and text | 2010 onward |
| STDEVA | Sample standard deviation | Text and logical values evaluated | 2003 onward |
| STDEVPA | Population standard deviation | Text and logical values evaluated | 2003 onward |
In all cases, empty cells are ignored.
Functions that evaluate text and logical values handle them as follows:
- Text is given a value of 0.
- TRUE is evaluated as 1.
- FALSE is evaluated as 0.
It would be correct to say that STDEV.S replaces the older STDEV as the sample standard deviation formula. Likewise, STDEV.P replaces the older STDEVP as the population standard deviation formula.
Unless you only have access to the older versions of Excel, it is recommended that you use the newer functions. They offer greater flexibility and it is uncertain how long Microsoft will continue to support the older versions.
If we apply the above knowledge to our sample weight loss data, we can see how Excel simplifies this task.
=STDEV.S(B2:B6)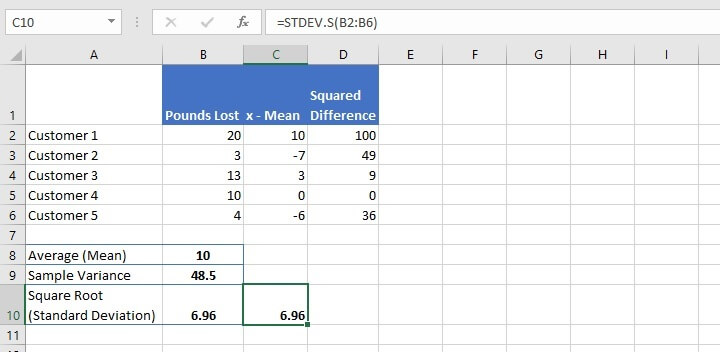 Using this uncomplicated formula to calculate the sample standard deviation, we get the same figure we arrived at from our manual calculations.
Standard error vs standard deviation
A brief mention of the Standard Error of Mean (“standard error” or “SEM”) seems appropriate here. It is another measure of variability of data, and while it isn’t as popular as standard deviation, it is an important measure in statistical studies.
Standard error refers to the degree to which a sample mean deviates from the actual mean of a population. It is calculated by dividing the standard deviation of a dataset by the square root of the number of values within the dataset.
While there is no built-in standard error formula in Excel, we can calculate the standard error of mean by using the functions STDEV.S, SQRT, and COUNT.
=STDEV.S(B2:B6)/SQRT(COUNT(B2:B6))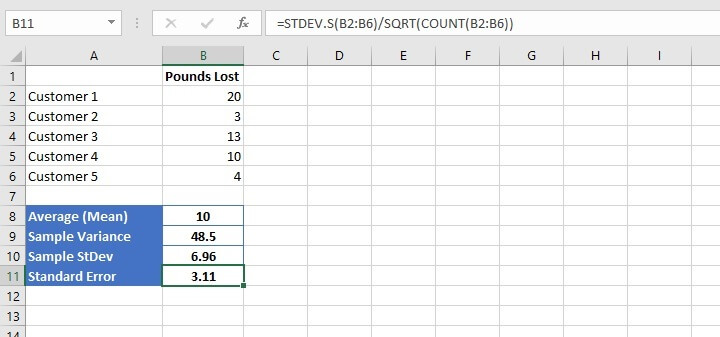 A small SEM is an indication that the sample mean is a more accurate reflection of the actual population mean, while a larger sample size will normally result in a smaller standard error.
Handling logical and text functions
The introduction of the STDEVA and STDEVPA functions adds a layer of flexibility in how data with text and logical values are treated. To illustrate why there may be a need for this, imagine that there are twelve boys in an English class, and their height in centimeters is shown below.
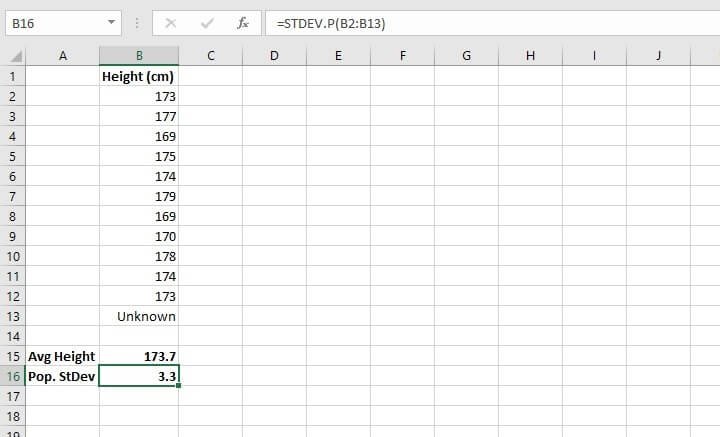 Perhaps the boy whose height is represented by cell B13 was absent on that day, and so his height was not recorded. A text value “Unknown” was entered instead.
The average height is calculated as 173.7 cm in cell B15. Since the "population" in this case is only the boys in this English class, with no intention of inferring anything about a larger population, the STDEV.P formula was used to arrive at a standard deviation of 3.3.
The issue, however, is that the absent boy may have had a height that was significantly less or greater than the others, which would have completely changed the results we have now. But since the arithmetic mean and the STDEV.P formula both ignore text values, that unknown value is unaccounted for.
Therefore, a decision is often taken to use the more inclusive STEVPA function for population data and STDEVPA for sample data as a way of acknowledging that text or TRUE and FALSE logical values. TRUE is given a numerical value of 1, FALSE is given a numerical value of 0, and text is also evaluated as 0.
We would therefore enter the formula:
=STDEVPA(B2:B13)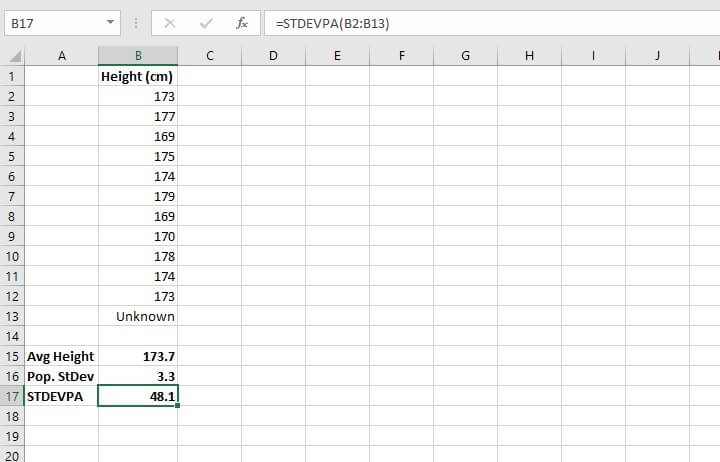 Our standard deviation of 48.1 is now quite different from the previous value of 3.3. The larger the standard deviation, the greater the possibility that values will differ from the mean. In financial settings, this is considered an increased risk, as predictability decreases as standard deviation increases.
Summary
Whether this is new territory for you or you already understand statistics, Excel has an entire library of statistical formulas and GoSkills is ready to break them down for you. Check out our resource library for more Excel tips!
To upgrade your Excel skills you can explore our course library. Here are some course recommendations to start with:
- For a quick roundup of Excel basics: Excel in an Hour (free)
- For a comprehensive look at Excel: Microsoft Excel - Basic and Advanced