
If you’ve ever experimented with different variables to see how your changes would affect the outcome of a situation, you’ve done a what-if analysis.
Would you be able to sell more items if you had a sale this week? Or would you make more money by increasing the price instead? In the above scenarios, you want to know the degree to which each change affects the overall outcome. For this reason, a what-if analysis is also known as a sensitivity analysis.
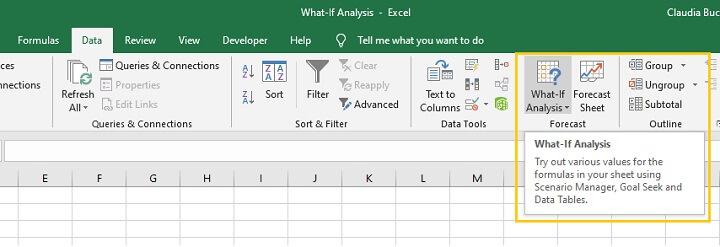
Most what-if analyses are really mathematical calculations, and that is Excel’s specialty. To help you do a what-if analysis, Excel uses commands from the Forecast command group on the Data tab to prepare simple forecasts or advanced business models.
It's time to learn what-if analysis in Excel. Let's go!
Goal Seek
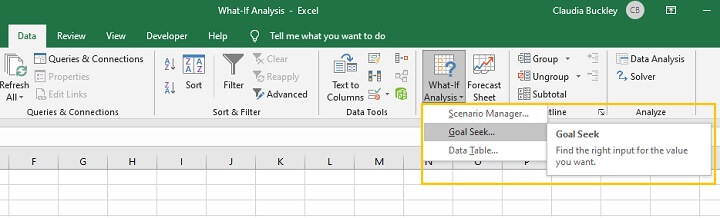
The simplest sensitivity analysis tool in Excel is Goal Seek. Assuming that you know the single outcome you would like to achieve, the Goal Seek feature in Excel allows you to arrive at that goal by mathematically adjusting a single variable within the equation.
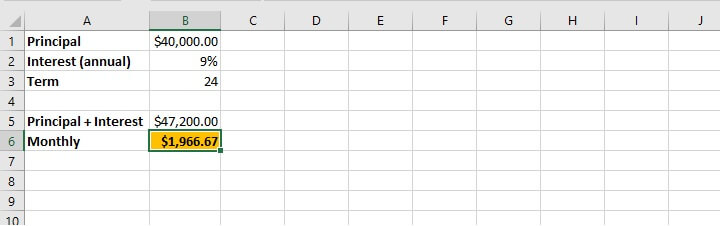
 To illustrate how it works, imagine that the bank is offering an interest rate of 9% per annum on personal loans with 24 months to repay, and that you would like to borrow $40,000.
Download your free Excel practice file
Use this free Excel file to practice what if analysis along with the tutorial.
Using the above information, the bank calculates that the amount borrowed plus interest over the loan period will be $47,200, as shown in cell B5. The amount to be paid each month is also calculated and shown in cell B6.
 By using the Goal Seek command, we can indicate a desired outcome and Excel will determine the adjustment we need to make to a single variable.
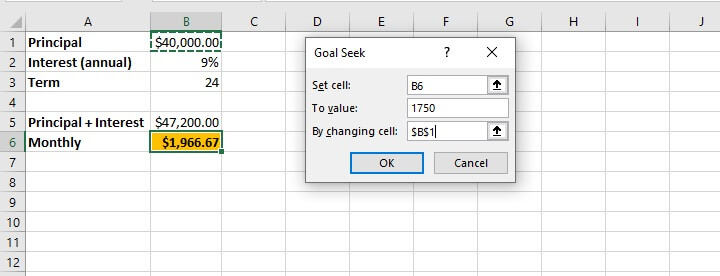
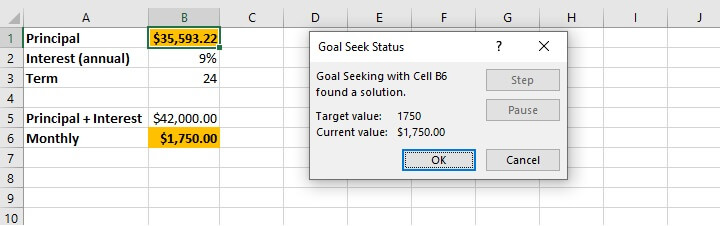
In the example above, cell B5 is dependent on the variables in cells B1, B2, and B3. Cell B6 is dependent on cells B3 and B5. Therefore, if we determine that the monthly repayment amount quoted is higher than desired, we can use Goal Seek to set the monthly amount to $1750. Excel can work backwards to change either cell B1, B2, or B3 to reach that goal.
Practically speaking, we may not have much control over the interest rate, so it is more likely that we have the option of adjusting the amount we borrow, or the repayment period.
Our first inclination may be to find out how much we will be able to borrow if we pay $1750 per month and all other variables remain the same. Excel will change the principal (B1) based on the number we enter as the new value for cell B6.
 Assuming that the interest amount (9%) and loan period (24 months) remain the same, the new principal amount is calculated and displayed in cell B1 if a valid solution exists.
 Points to note:
- The cell chosen in the “Set cell” field must be a cell containing a formula.
- The cell chosen in the “By changing cell” field must be a cell containing a constant.
- Once “OK” is selected from the Goal Seek Status window, the values on the worksheet are adjusted and are only retrievable by selecting the ‘Undo’ command (Ctrl+Z Windows shortcut/Cmd+Z Mac shortcut).
Scenario Manager
Another what if analysis tool is the Scenario Manager. This option is somewhat more advanced than Goal Seek in that it allows the adjustment of multiple variables at the same time.
 Some other noticeable differences between Goal Seek and Scenario Manager are listed below:
- The Scenario Manager allows the creation of an unlimited number of possible scenarios by changing up to 32 variables at a time.
- Each scenario can be saved for comparative purposes.
- Scenarios may be named and edited, and a brief description provided.
- Only constant values should be changed within the Scenario Manager — cells with formulas should not be manually adjusted.
If we continue our bank loan example, we can determine our model’s sensitivity to change by adjusting any or all of the values in cell B1, B2, or B3.
Best practice
As a best practice, the original worksheet data should be saved as a scenario so that you can revert to it after all the experiments have been completed.
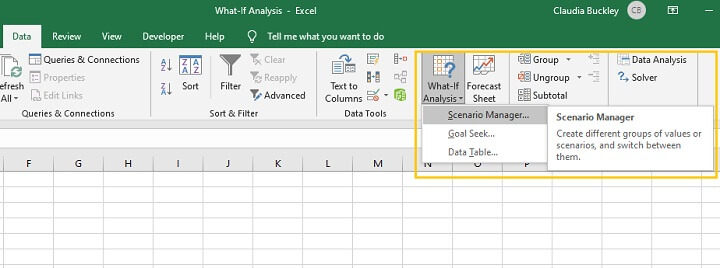
Step 1 - Click ‘What If Analysis’ from the Data tab and select Scenario Manager.
Step 2 - Click ‘Add’ from the Scenario Manager pop-up window.
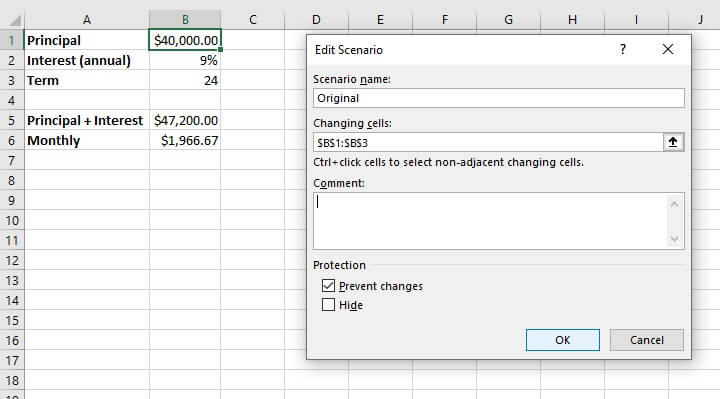
Step 3 - Name this scenario “Original” and enter the cell references of all cells with constant values that you may consider changing in other scenarios (maximum 32 cells). Click OK.
 Step 4 - For the “Original” scenario, do not adjust any values in the ‘Scenario Values’ window.
 Step 5 - Click ‘Add’ to create your first experimental scenario.
Creating experimental scenarios
When creating an experimental scenario, give the scenario a descriptive name from the ‘Add Scenario’ pop-up window. The changing cells will be the same as the ones referenced in your ‘Original’ scenario.
Even if you will not be adjusting all the values in those cells, it is highly recommended that they remain referenced in the ‘changing cells’ field. You may place additional details about the experimental scenario in the ‘Comment’ field (see below).
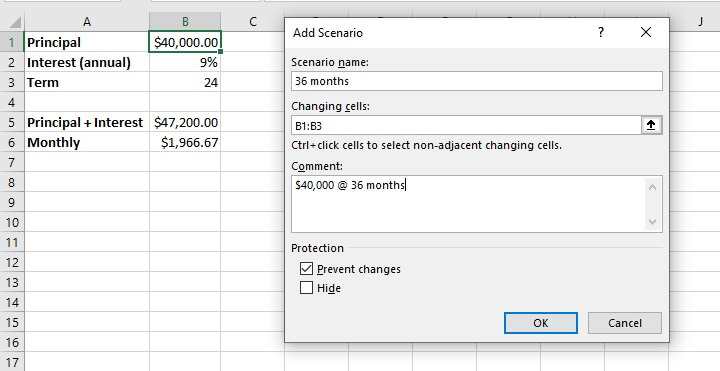 As illustrated above, our experimental scenario is given the name “36 months” and refers to cells B1 to B3 as changing cells. An additional comment indicates that this scenario is to determine the effect of borrowing $40,000 over a 36-month period.
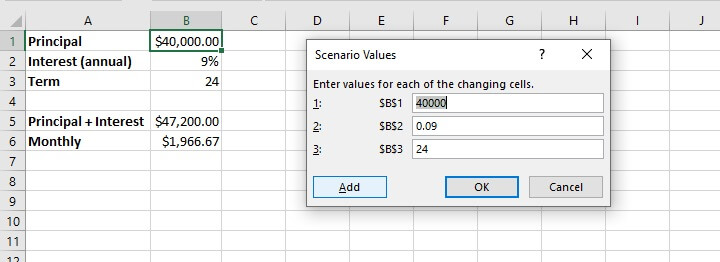
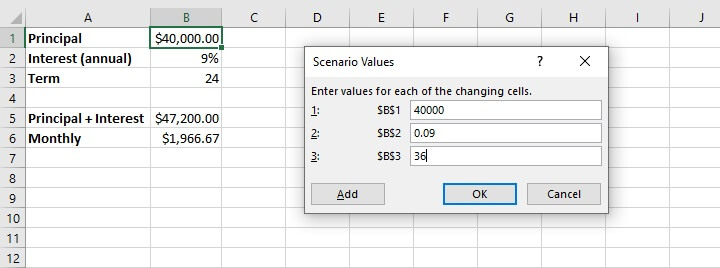
In the ‘Scenario Values’ window, each changing cell is displayed as a field where we can manipulate the constant value so as to affect the outcome of the dependent cells — in our case, cells B5 and B6. As described in our scenario name and comments, we only adjust cell B3 by changing the value to 36.
To add another scenario at this point, select ‘Add’. If not, click OK.
Adjust multiple variables
To experiment with adjusting multiple variables within one scenario, the steps are the same as above, with the exception that the desired changes would be made in the Scenario Values window.
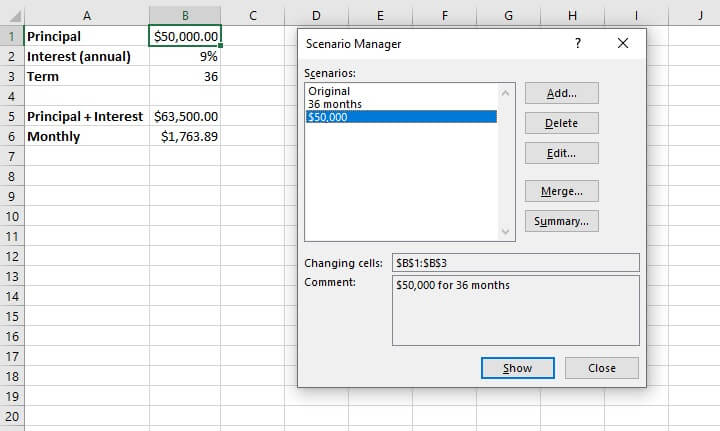
For example, to get Excel to perform a what if analysis on borrowing $50,000 over a 36-month period in the above situation at the same rate of interest, we would simply adjust the fields referencing those variables after creating a new scenario. Excel’s Scenario Manager can handle an unlimited number of scenarios created in this same way.
A list of created scenarios can be viewed by clicking OK from the Scenario Values window, or by selecting Scenario Manager from the What If Analysis dropdown menu.
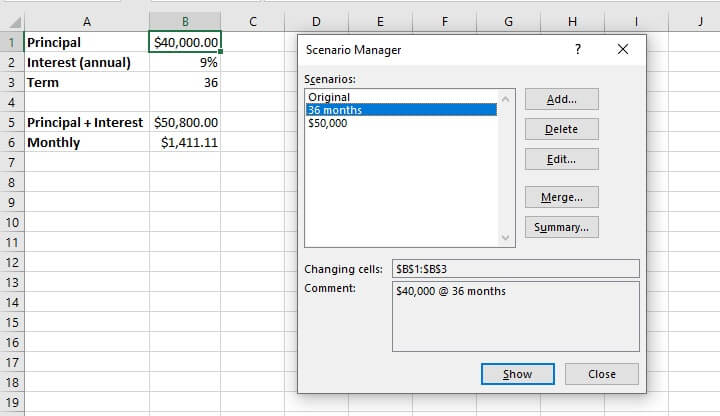
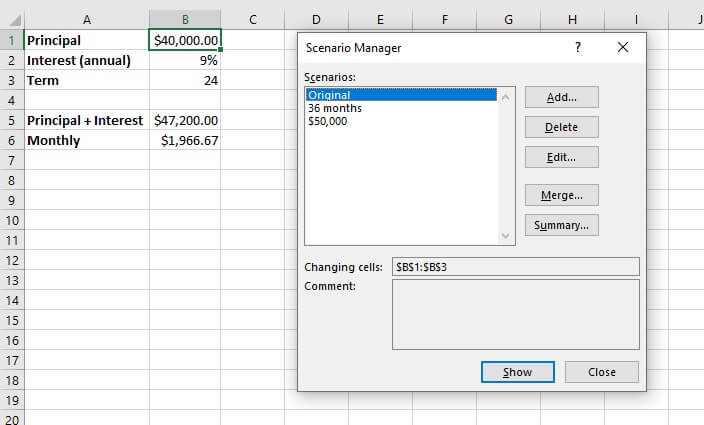 To see the outcome of each adjustment on the output cell(s), either double click on a scenario name, or highlight a name and click Show.
Scenario summary
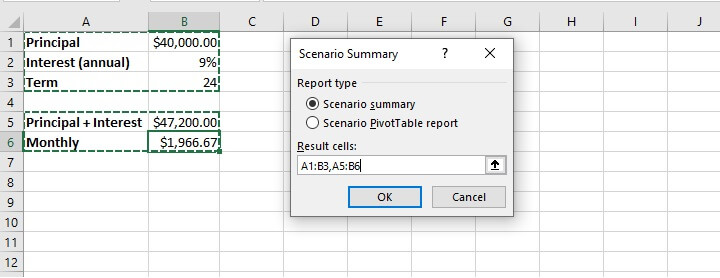
Scenarios that have been created may also be compared side by side with the creation of a Scenario summary worksheet, which is generated by selecting ‘Summary’ from the Scenario Manager window.
There are two report types available — Scenario summary and Scenario PivotTable report. Result cells are the cells that will be displayed in the summary. Ideally, these should include all cells which were adjusted as well as result cells. It’s also a good idea to select cells that contain header names so that these are clearly displayed in the summary.
 Choosing the ‘Scenario summary’ option will create a new sheet within the workbook that displays each scenario in columnar format. Changing Cells are highlighted in gray, and Result Cells are displayed under Changing Cells.
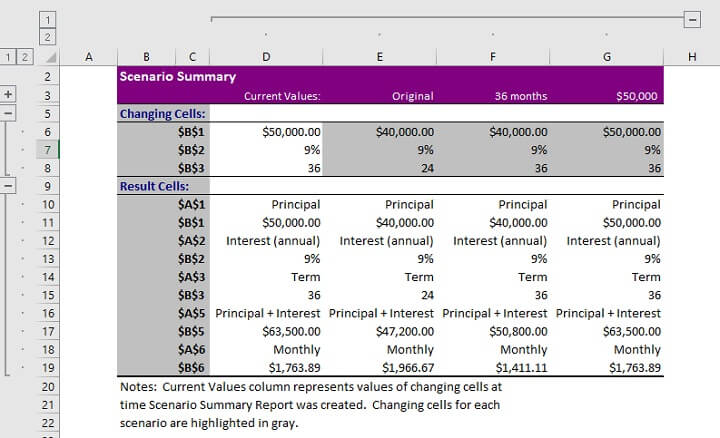 Note that if named ranges were created for Changing or Result Cells, range names will be displayed instead of cell references.
Selecting the Scenario PivotTable report type will create a pivot table report in a new worksheet. Learn more about pivot tables from our Resource Library.
Using data tables for what if analysis
The third what if analysis tool from the Forecast command group is the Data Table. Data tables allow the adjustment of only one or two variables within a dataset, but each variable can have an unlimited number of possible values. Data tables are designed for side-by-side comparisons in a way that makes them easier to read than scenarios, once they are set up correctly.
Data tables are under-utilized, but are not as scary as they may seem.
One-variable data tables
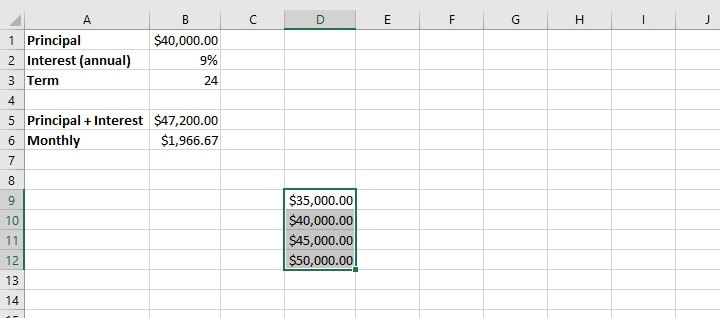
If the only variable to be considered in our loan example were the amount being borrowed, we could set up a one-variable data table.
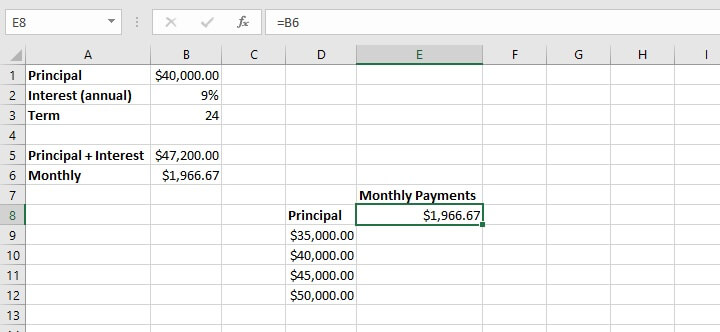
Step 1 - make a list of all possible principal loan amounts. The list may be by column or row. In our example, we will enter a column list in the range D9 to D12.
 Step 2 - In an adjacent column, enter the formula which was used to arrive at the original outcome. In this case, we can simply type =B6 in cell E8. This links our new data table to the original variables.
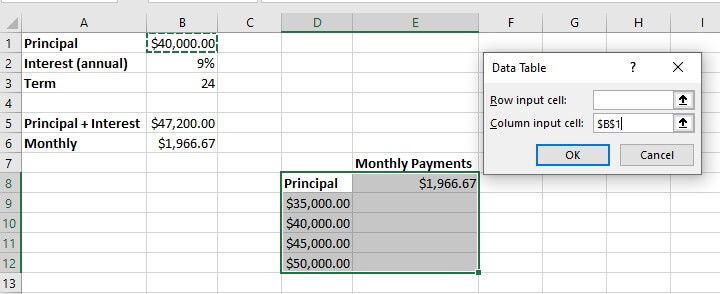
 Step 3 - Select the entire data table range, including the list of variable values, the formula, and blank cells.
Step 4 - From the What If Analysis dropdown menu, select Data Table.
Step 5 - In the column input cell field (since we entered our variables in column format), enter the cell reference that was used to calculate the result in the original dataset. In the above example, this would be cell B1 since this is the variable we have adjusted. No value is entered in the ‘Row input cell’ field in this instance since this is a one-variable data table.
 Step 6 - Select OK. The result is a list of outcomes created by adjusting the one variable in cell B1, assuming that all other variables remain constant.
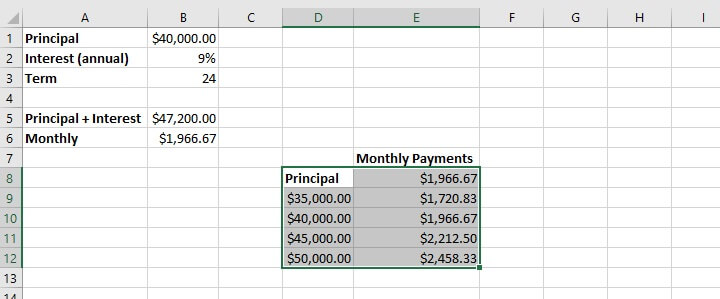 To create a row-oriented data table, the variables would be listed horizontally, and the row input cell would be used in the Data Table window instead of the column input cell.
Two-variable data tables
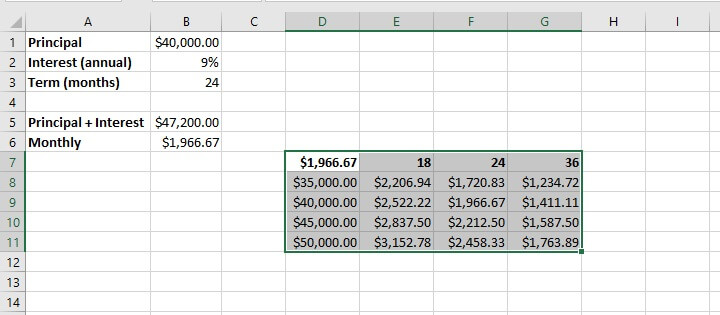
When creating a two-variable data table, one set of values is listed horizontally and the other set is listed vertically. In our example, we will add the loan period (term) as our second variable, displayed horizontally.
In this case, the formula which was used to arrive at the original outcome must be replicated above the vertical list of variables. As shown below, we type =B6 in cell D7. This links our new data table to the original variables.
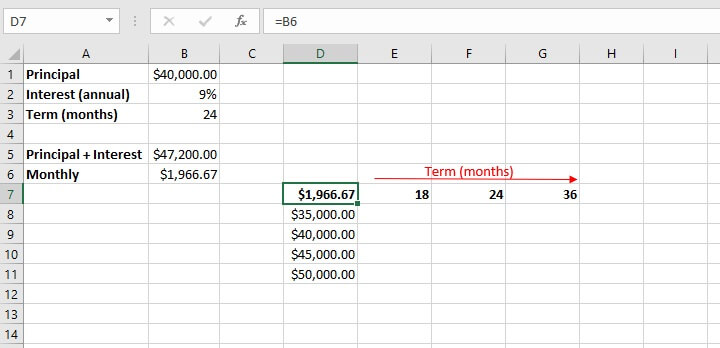 As before, highlight the entire data table range and select Data Table from the What If Analysis menu. The row input cell is the cell reference (B3) that corresponds to the horizontal variables from the original dataset, while the column input cell (B1) corresponds to the vertical variables.
When we select OK, Excel returns a matrix that can be used to compare the outcome of different changes to our original scenario. It may be necessary to adjust the output cells to the appropriate number format for your data type (in the case of the above example, currency).
Summary
Now that you’ve taken the time to demystify how to do a what if analysis in Excel by using these three main tools, why not experiment with using them in different settings — like budget management, profit margin percentages, project completion targets, and the like?
Once you get the hang of these, you’ll want to check out our resource center and take our Basic and Advanced Excel course to become a real pro!