
It's time to dive into Excel Challenge #31!
Are you ready to flex your data analysis skills using Power Query and Pivot Tables? If so, then this challenge is for you!
Everything you need to participate in the challenge can be found below. To take part:
- First, watch the challenge video and read the instructions below the video.
- Review the previously published video(s) and article(s) on which the challenge is based.
- Download the Excel worksheet you will use to complete the challenge tasks.
- Put yourself to the test!
Take the challenge!
Download the FREE challenge file to test your Excel skills.
Want to chat about your approach and process with other Excel-heads? Join our Slack channel to share your insights and questions with like-minded learners.
The challenge 🤺
Here’s the scenario to be solved from the download file:
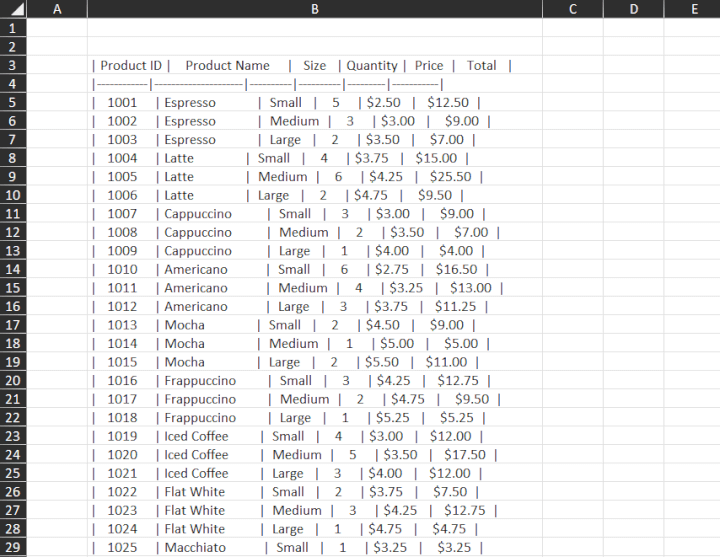
We run a coffee shop and have downloaded this month’s sales data from a third-party system into Excel. We want to analyze this data in a Pivot Table and quickly see the total sales for each coffee type by coffee size.
However, the data is a bit of a mess.
It’s our job to tidy up this data in Power Query and then create a Pivot Table to show this analysis.
Currently, the data has a few problems:
- All fields are in one column.
- There is a row that needs to be deleted.
- There are erroneous spaces throughout the data that need to be removed.
- The data in the columns is not formatted correctly.
We can tidy up this data and fix these issues using Power Query.
Some points to think about before you begin:
- Make a note of the delimiter that separates each field.
- Think about how you might remove spaces in the data and the header row.
- Remember to load the data back into Excel as an Excel table.
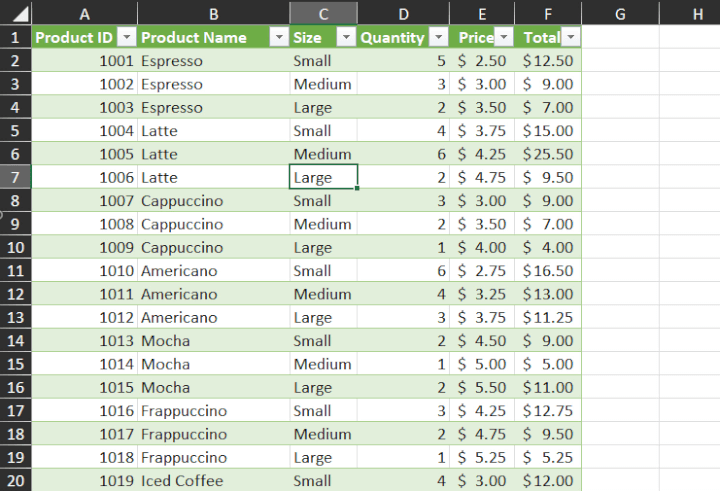 Once the data is clean and loaded into Excel, we can analyze it with a Pivot Table.
Ensure the Pivot Table has the following properties:
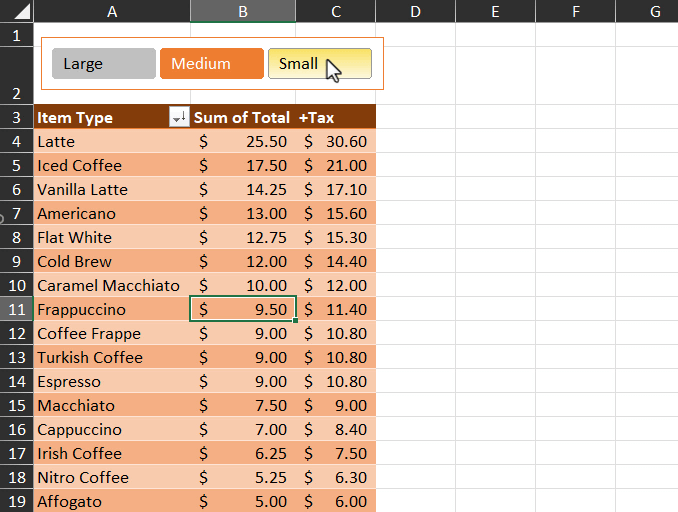
- Perform an analysis to show the Total Sales by Product.
- Apply a dark orange Pivot Table style that has banded rows toggled on.
- Apply Accounting number format with two decimal places.
- Add a Slicer to filter the data by Size.
- Format the slicer so that the sizes run horizontally instead of vertically.
- Remove the slicer header.
- Position the slicer above the Pivot Table.
- Apply a dark orange slicer style.
- Add a Calculated Field to the Pivot Table that calculates the total with 20% tax added.
- Sort the Pivot Table data from largest to smallest.
Would you like to test your knowledge further? Try creating a Pivot Chart from the Pivot Table data!
How quickly can you complete this challenge? Fifteen minutes? Ten? Less?
Take the challenge!
Download the FREE challenge file to test your Excel skills.
If you’re just getting started with Excel, all the knowledge you need to solve this challenge has been shown in the above videos.
If you’re already proficient with Excel, this should be pretty easy. Maybe you can tell us a creative way to solve this problem in our Slack channel.
Have fun!
The solution💡
We hope you enjoyed taking part in this challenge! Stay tuned to the GoSkills Excel Resource hub for more Excel challenges, and check out our range of expert-led Excel courses for all skill levels to further sharpen your skills.
Want to learn more about Power Query? Let Microsoft MVP Ken Puls guide you through the process in our self-paced Excel Power Query course!

Join the Excel conversation on Slack
Ask a question or join the conversation regarding Excel challenges on our Slack channel.
Join Slack channel