
Building effective dashboards is a skill like any other — the skill to present data in a concise and meaningful way for readers to interpret easily.
Many dashboards fail to clearly show the information and the insights that they were intended to. This leaves the readers confused and frustrated.
This resource will detail 12 best practices in dashboard design to ensure that you are presenting the information in the best possible way.
Learn the best Excel shortcuts
Download our printable shortcut cheatsheet for PC and Mac
What is a dashboard?
A dashboard is a visual presentation of key information. They can consist of many different elements such as charts, tables, icons, and interactive controls.
All of this is cleverly designed into a compact area for display on different devices. Readers should be able to easily interpret the information to make critical decisions.
Type of dashboards
There are many different types of dashboards, each with their own story to tell.
These include dashboards to monitor sales, real-time call center data, social media activity, and to track a project. There are also business performance dashboards to track key metrics and KPI’s.
Each of these has a different purpose and different data to present to the reader. It is up to the designer to know what data to show and to show it effectively.
Best practices for dashboard design
Whatever the goal of your dashboard, the following best practices will put you on the right path to creating effective dashboards.
1. What story are you trying to tell?
What is the purpose of your dashboard? Is it:
- An overview of performance on a project or over the calendar year?
- To compare relative time such as this week vs last week, or this month vs last month?
- To show detail on an element such as a specific product, employee, or region?
Before you start to present anything, you need to have a clear idea of why you are creating this dashboard and what information it needs to show.
You probably have a lot of data, and this may be from a variety of sources. You need to decide what is useful and what is not.
2. Decide on the layout
Once you know what information to display, you need to triage it. Decide what information is most important and give it a more prominent position on the dashboard.
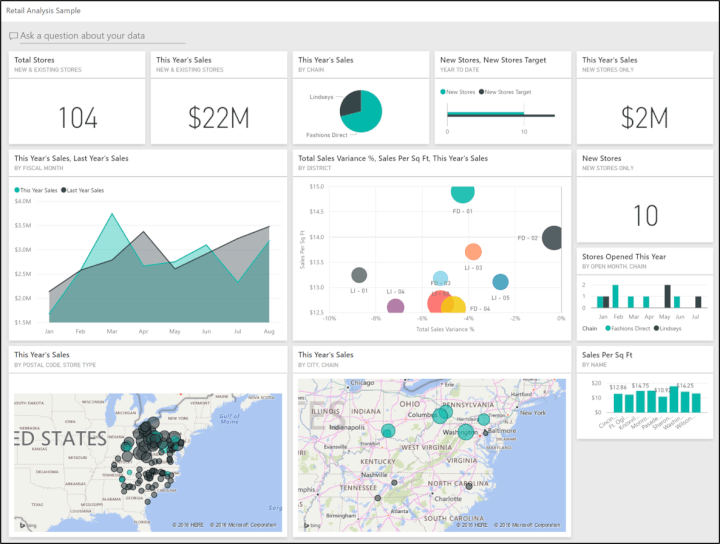
The areas of the dashboard that get the most attention are the top and down the left. Therefore this is where your most important information, visuals, and interactive elements should be used.
The retail analysis dashboard below shows high-level metrics at the top and works down to the more granular data such as sales by city.
 Draw out your dashboard to get an idea of where everything should go. And think about your dashboard on different devices. How should it look on a mobile compared to a large screen?
When creating a dashboard in Power BI, they have a great feature to create a mobile version of your report.
3. Think of your audience
One of the most important dashboard design principles is to put yourself in the shoes of your audience.
If you were the reader of this report, how would you use it? How would you want to interact with it? And what other questions might arise as you view the information?
Your goal is to create a dashboard that presents the data in a meaningful way that your readers can understand instantly. And they should be able to easily and instinctively navigate the report.
If you imagine yourself as the reader, and more importantly use and test the dashboard during and after creation, you will get it right.
4. Use the right visuals
An area that many people get wrong is the visuals that they choose. Should the information be shown in a table or a chart? And what chart is the best representation of that data?
Excel, and even more so Power BI, have such a variety of visuals that it can be overwhelming and confusing for users. Each chart has a purpose. For example, you would likely use a pie chart in your Power BI dashboard to show percentages of a whole, but not to show changes over time. Do some research to ensure that you are picking the correct chart for the job.
5. Make it interactive
Add interactive elements to your dashboards so that users can easily navigate, filter, and sort the information.
Power BI provides rich interactivity between the visuals on your dashboard. This makes it easy for you to decide if, and how, the visuals interact with each other. There are also features in Power BI such as Slicers, Drillthrough, and the Filter Pane.
The image below has the column chart selected. You can see the options to decide how that chart could interact with the five other elements on the dashboard. There is also a Slicer to set a date range filter.
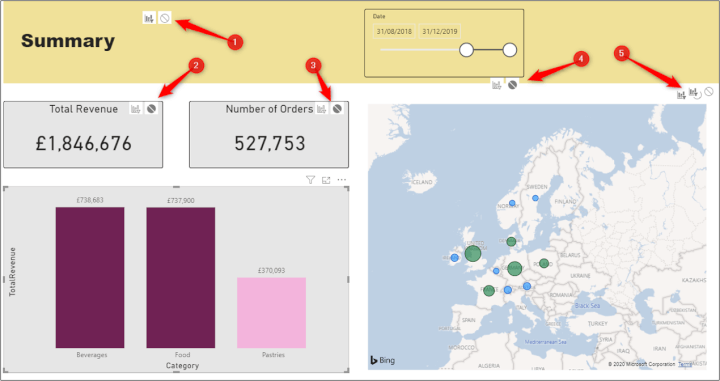 This gives you great control over how a dashboard can and should be used. This benefits everybody, and most importantly the dashboards audience.
6. Remove the fluff
If something does not add to the story your dashboard is trying to tell, get rid of it. Many dashboards are built with so much fluff, and this detracts from the message. Sometimes less is more, and simple is better.
7. Add context
Do the users know what the values mean? Or know what to expect? It is important to provide context to your values and your visuals.
If you are comparing a value to another such as a target, KPI, or last week's value, indicate whether there was success or not, and what was the margin of difference. This can be done using color or simple symbols such as up and down arrows.
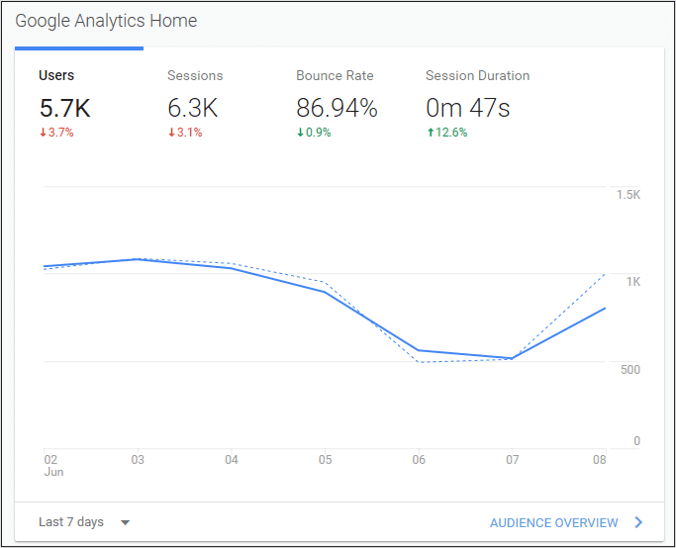
In the Google Analytics sample below the green font indicates good, and the red is bad. With the bounce rate metric having a down arrow, the green font provides that context that down is an improvement with that data type.
 This significantly reduces the confusion when looking at visuals such as this. Even if you understand what you are looking at, the clarity is important to prevent it from being misunderstood.
This example also shows a blue bar along the top of the users metric to indicate the values used by the line graph. There is also a dotted blue line indicating last week’s values.
This is a great example of best practices in dashboard design. Lots of information in a small space, whilst still keeping it simple and easily understood.
8. Use contrast
Add contrast to draw users’ eyes to what is important. Add more emphasis to headers and key values by making fonts larger or use a darker color.
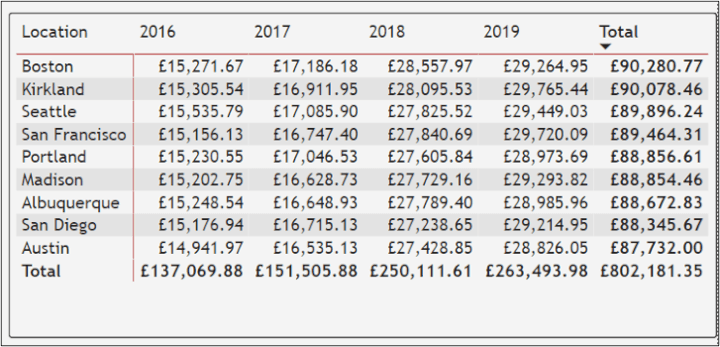
The image below uses banded row formatting in a table. This contrast between the rows aids the user in reading left to right and helps them to not confuse a value with the wrong city.
There are also red borders to section off the headings and the totals are in a bold font to emphasize them.
9. Organize and group elements
Create associations by organizing and grouping dashboard elements sensibly.
Make it clear to readers that visuals are related, especially if they interact with each other. This can be done by grouping them within borders or color shading. Simple but effective.
10. Be consistent with fonts and colors
You do not want to dazzle your readers with too many colors and fonts. Keep these minimal and consistent.
In Excel, you can set style to tables, PivotTables, and Slicers and this can keep the consistency between dashboard elements.
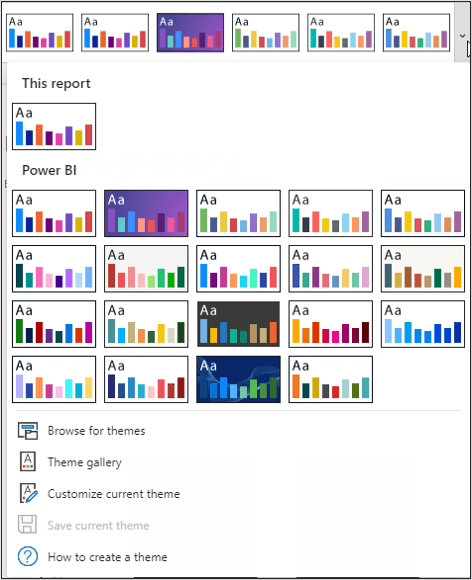
In Power BI there are themes. You can use existing built-in themes, explore those that others in the community have created, or even make your own. A theme is applied to all elements on a dashboard.
11. Use colors and labels effectively
One of the more intricate levels in dashboard design is the use of colors and labels. The software can have many options to choose between and it gets confusing. But this is a very important area.
Use descriptive labels on your visuals. Don’t throw away the opportunity to add more value to your dashboard. Colors can also add more depth to a visual. Tools such as Conditional Formatting in both Excel and Power BI can assist with this.
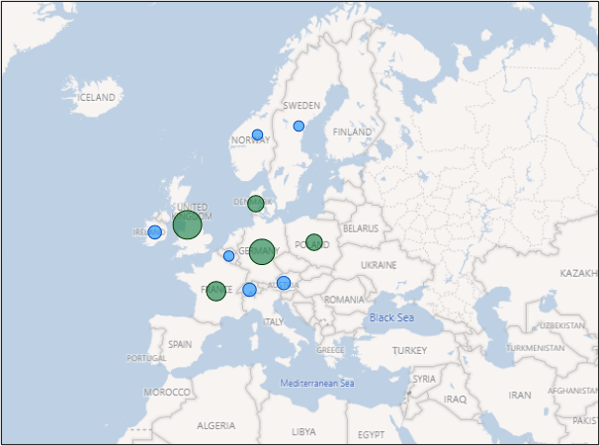
In the image below, a Conditional Formatting rule has been set for the values in the map. Those above a specified target automatically change to green.
12. Access to more detail
Don’t try to fit all the information on one page. Clutter will distract the reader. More detail can be made available on other dashboards, and then they can be intelligently linked together.
Power BI has a brilliant feature for this called drillthrough. It makes it easy to drill from an overview page to another with more detail on an item such as an employee, customer, or product.
In the image below there is a drillthrough set for the countries and it is being applied on Germany.
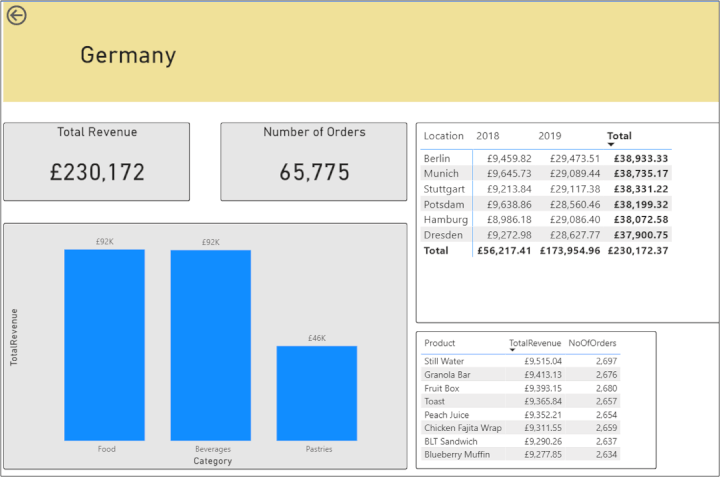
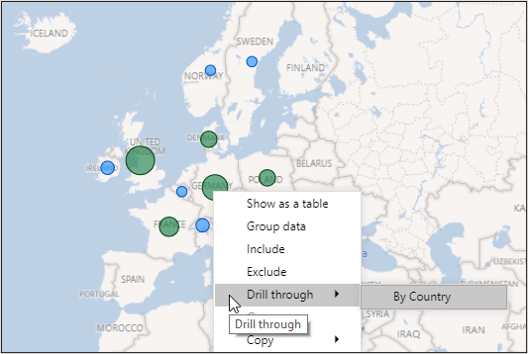 This takes the user to another dashboard and filters it by the country that drillthrough was initiated on.
Conclusion
This article covered some key design principles and best practices in dashboard design, but the best way to learn a skill is application. Keep these principles in mind as you create your Excel or Power BI dashboards.
Do you have the skills to create effective dashboards? Check out the GoSkills Excel Dashboards and Power BI online courses today to learn how to create your own beautiful, functional dashboards.