
An important part of being ready for a successful six sigma project is being familiar with the analyses that you’ll use to measure improvement in your processes.
One of the more useful analyses in your toolbelt can be the Analysis of Variance, commonly abbreviated ANOVA.
ANOVA covers a range of common analyses. Some analyses have names related to the number of factors, such as one-way ANOVA and two-way ANOVA. When the levels of a factor are selected at random from a wide number of possibilities, you might use a random-effects model or a mixed-effects model.
And luckily, Microsoft Excel makes it easy to perform these analyses. So we're going to go through how to use ANOVA in Excel.
What is ANOVA?
While ANOVA has many varieties, the essential purpose of this family of analyses is to determine whether factors have an association with an outcome variable.
Factors are the variables that you will use to categorize your outcome variable into groups. For example, if you want to know whether tapes from three different suppliers have the same peel strength, the suppliers are your factor. All the strength measurements for the same supplier’s tape form a group of measurements.
ANOVA is an inferential statistical analysis.
Inferential analysis is the formal way of saying that we want to look at a sample of measurements and make an educated guess about what all of the possible measurements might be like if we could take them.
Let’s return to the tape example. If you could tape 1 million boxes from a batch of tape, those million might represent the entire population that we want to know about. But if we taped those million boxes and measured the peel strength, we would have used up all of the tape. Instead, we’ll measure the strength from a sample of taped boxes and use those measurements to guess what the numbers would look like if we taped a million boxes.

What does ANOVA do?
An important point is that we won’t expect all the measurements in a group to be the same.
Consider the tape example again. The differences in strength measurements from the same supplier’s tape give us within-group variation. Another important point is that we won’t expect the average strength of our sample to be the same as the average strength if we taped a million boxes. This variation between the sample average and the overall average we’ll call bias.
Because of within-group variation and bias, comparisons among groups become harder. We'll know that our sample average is not the same as the real average, there’s no easy way to know when our guess is too high or too low. If we guess too high for one group and too low for another group, we might easily reach an incorrect conclusion, such as predicting that the supplier with the strongest tape on average has the weakest tape.
Free lesson from GoSkills Hypothesis Testing course by Ray Sheen, LSS BB
ANOVA gives us mathematical sets of rules, that hold certain given assumptions, to decide when we can have confidence that the real average of one group is different from the real average of one or more other groups. ANOVA sets up these rules by asking how sure we are that the means are the same, a concept that we refer to as the null hypothesis. Remember that the null hypothesis is a useful concept for helping us make comparisons, even though we already know that for real group averages to all be the same would be a remarkable coincidence.
Most of the time, a key result of an ANOVA analysis is a p-value. The p-value has meaning only with respect to the null hypothesis of the ANOVA analysis. For one-way ANOVA, the null hypothesis is that the means for each level of your factor are the same.
A rough interpretation would be that the p-value reflects how much confidence you can have that the null hypothesis is a reasonable model. Small p-values make you think that the null hypothesis is not a reasonable model. Large p-values might lead you to act like the null hypothesis is true, even though you know that it’s not really true, just a reasonable model.
To learn more, check out this glossary of Lean Six Sigma terms
Let’s work through a practical example in Excel. We’ll begin with one-way ANOVA, which looks at the effect of a single factor.
The Data Analysis Toolpak in Excel
If you’re analyzing data in Excel, then it’s natural to make use of the tools that Microsoft provides for you. One of the less obvious features in Excel is the Data Analysis Toolpak. The Toolpak is an Excel add-in from Microsoft that’s included with Excel, but isn’t turned on.
Download your data files
Follow along with the steps in the article by downloading these practice files
Here’s how to turn it on in the Microsoft Windows operating system.
- Choose File, then Options
- In the Excel Options Window, choose Add-ins
- Next to Manage, select Excel Add-ins and click Go
- In the Add-ins window, select Analysis ToolPak and click OK

A new button will appear on your Data ribbon.

Example of one-way ANOVA in Excel’s Data Analysis Toolpak
While it can sometimes seem like a simple analysis will have the fewest applications, it’s easy to find practical ways to use one-way ANOVA. Essentially, you can use it anytime you have only one set of groups to compare.
Let’s keep going with our tape example. You’ve invested in an automatic taping machine that applies heat to tape to create strong bonds. You’ve decided that you’re going to measure the strengths of tape samples from different suppliers yourself so that you can see whether there’s any practical difference in the strengths of the bonds using your machine and your boxes.
Data arrangement for one-way ANOVA in Excel
If you’ve been using Excel for a long time, you’ve gotten used to the idea that the spreadsheet is cell-based. That is, there’s very little difference between putting numbers in the spreadsheet in rows or in columns.
Data in rows:
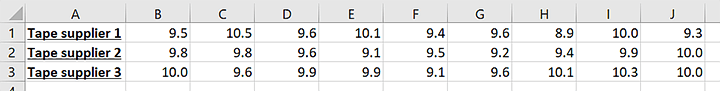
Data in columns:
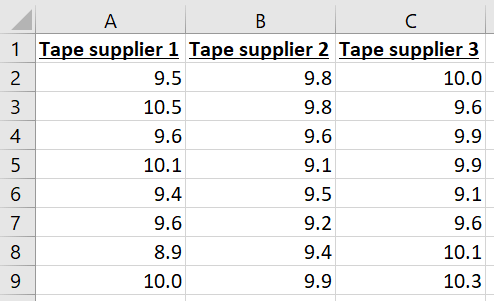
Microsoft’s been nice enough to make it so that their one-way ANOVA feature can work either way, but I’ll recommend that you start putting your data in columns. The data arrangement will matter when you want to use some of the other offerings in the Data Analysis Toolpak or a software package for data analysis, like Minitab Statistical Software.
If you’d like to follow along with data that’s already prearranged, you can use the following Excel file:
Download your data files
Follow along with the steps in the article by downloading these practice files
How to use one-way ANOVA in Excel
With the Data Analysis Toolpak installed and your data in columns, you can perform the following steps in Excel to get the results of the one-way ANOVA analysis.
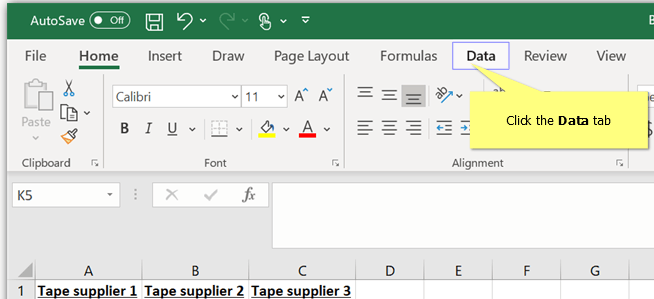
1. Click the Data tab
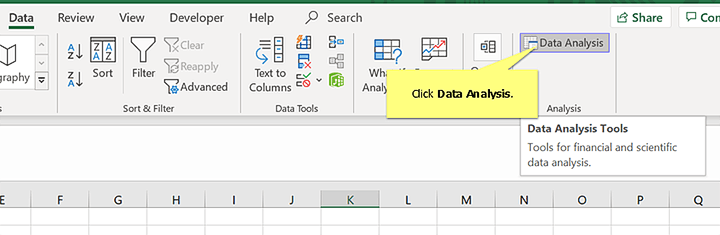
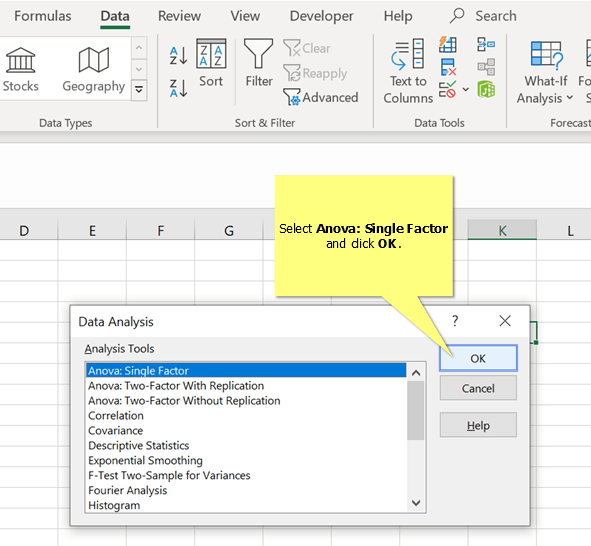
2. Click Data Analysis
3. Select Anova: Single Factor and click OK
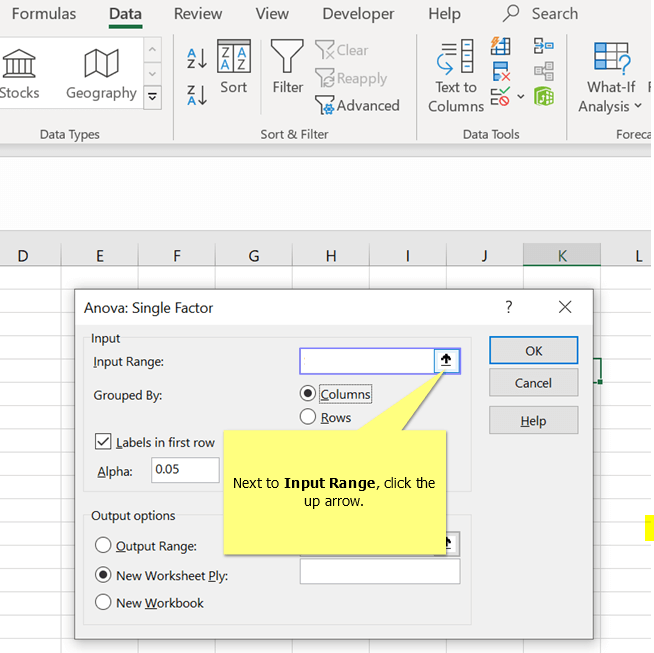
4. Next to Input Range click the up arrow
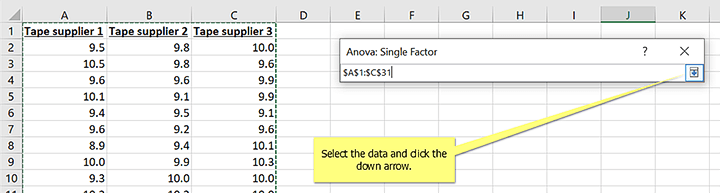
5. Select the data and click the down arrow
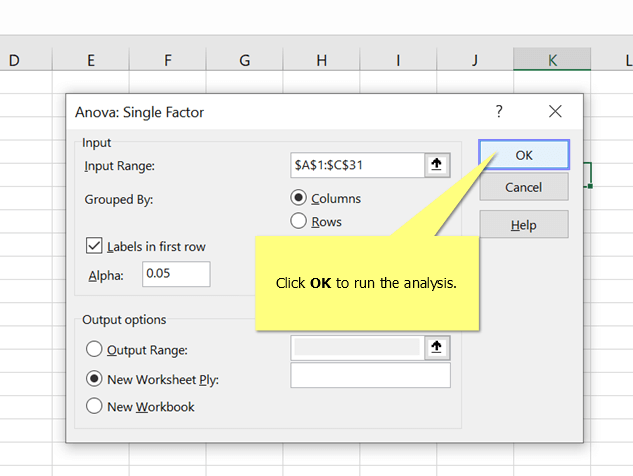
6. Click OK to run the analysis
Results for one-way ANOVA in Excel: Summary statistics
The results will look like this:
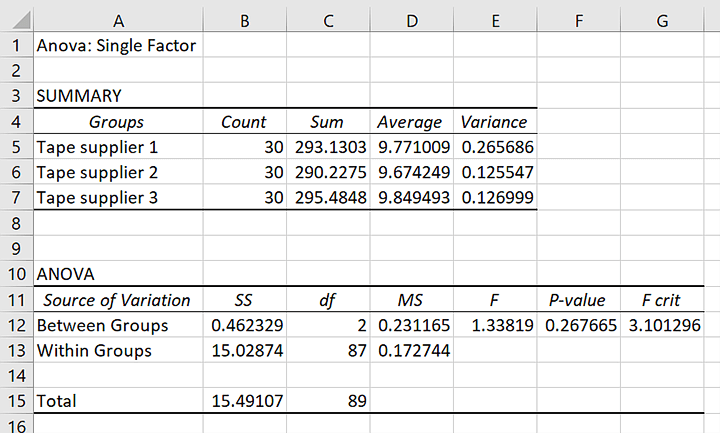
First, let’s take a minute to look at the summary statistics of each group.
In particular, the averages, in ascending order, are about 9.67, 9.77, and 9.84. That is, each of the tapes holds almost 10 kg before breaking. The difference between the largest mean and the smallest mean is about 0.17 kg. If kilograms aren’t very familiar to you, you can think of the tape with the lowest average being strong enough to hold about 60 apples and the tape with the highest average being strong enough to hold about 62 apples.
That should be enough for us to start to think about what we expect about the null hypothesis for the ANOVA. If you think that the means are similar, then you’ll expect to see a larger p-value for the hypothesis test.
Results for one-way ANOVA in Excel: Hypothesis tests
Remember that small p-values give us low confidence in the null hypothesis.
The value of about 0.27 is higher than the level where people traditionally agree that there is strong evidence against the null hypothesis. While most people learn 0.05 as a traditional cutoff, that value is mutable depending on the consequences of making an error either by deciding to act as if the means are the same or by acting like the means are not all the same.
Even so, 0.27 is such a large p-value that a lot of uncertainty remains about whether any of the averages are different. By extension, there’s a lot of uncertainty about whether any one average is larger than another.
 If those 2 apples worth of strength are so much that you would make a different decision about the tape suppliers because of that difference, then you’ll need more data.
On the other hand, if those 2 apples don’t sound like a big deal, this is a good place to decide that you can choose the supplier with other criteria. For example, you might consider price or your confidence that the supplier can fill your orders on time.
What if you have more factors?
Let’s suppose that you’re considering not only the tape supplier, but also choosing among some different boxes.
You know that the roughness and absorbency of the box might affect how strong the tape holds to it. Instead of doing the test only on the factor of tape supplier, you want to make sure that you have the right tape for the right box.
One approach could be to do a one-way ANOVA where you use more than one factor to define the groups. For example, one of the groups might be the first tape supplier on the first box type. Another group might be the second tape supplier on a second box type.
The disadvantage of this approach is that it doesn’t let you distinguish the effect of different factors. If the one-way ANOVA said that there was a difference between those two groups, then you still wouldn’t know how much of the difference was from the change in tape, the change in box, or a change that depended on both simultaneously.
An analysis to get this type of information when you have two factors is two-way ANOVA.
Data Arrangement for Two-Way ANOVA in Excel
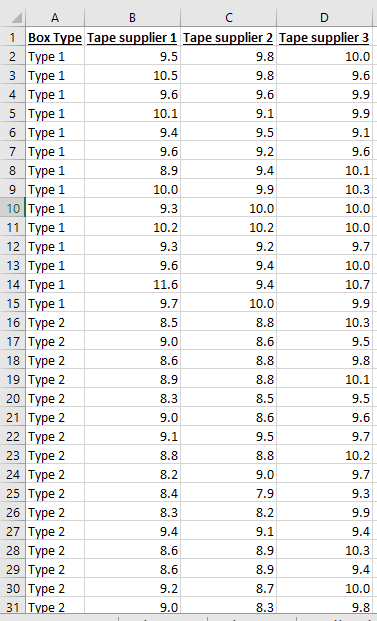
Excel can be flexible with your data arrangement for one-way ANOVA, but is strict about the data arrangement when you do a two-way ANOVA with replication through the Data Analysis Toolpak. Data for one factor need to be in different columns.
Data for the second factor need to be in consecutive rows.
For Excel to work, you’ll need to have the same number of measurements for all of your groups.
You don’t necessarily have to provide the factor label for the rows, but it’s good practice, especially if you might want to graph your data in Excel later. This data arrangement, called a two-way table, would look like this:
 If you’d like to follow along with data that’s already prearranged, you can use the following
Download your data files
Follow along with the steps in the article by downloading these practice files
How to use two-way ANOVA in Excel
With the Data Analysis Toolpak installed and your data in columns, you can perform the following steps in Excel to get the results of the two-way ANOVA analysis. You’ll begin as you did for one-way ANOVA.
Follow along with the two-way ANOVA steps
1. Click the Data tab

2. Click Data Analysis
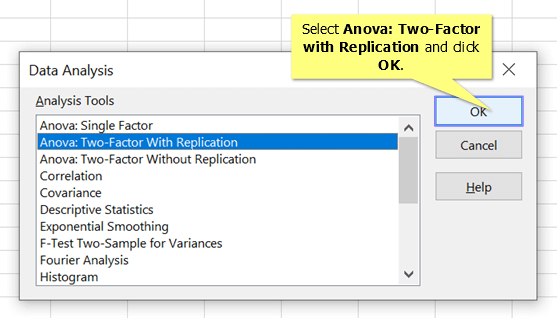
3. Select Anova: Two Factor with Replication and click OK
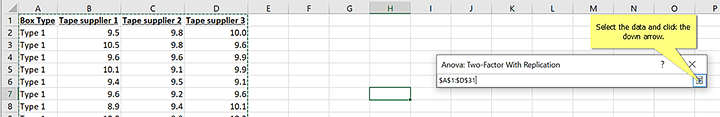
4. Next to Input Range, click the up arrow
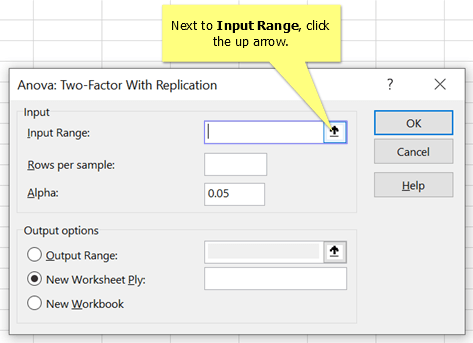
5. Select the data and click the down arrow
6. In Rows per sample, enter the number of measurements in the group, then click OK to run
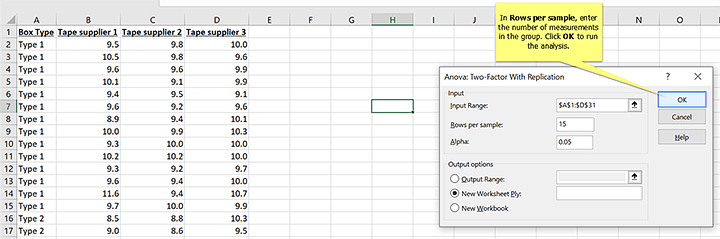 In this data, you can see that rows 2 to 15 have the measurements for the first box type. Those rows have 15 data points. Since the groups all have to have the same amount of data for the analysis to work in Excel, we know that the second box type must also have 15 rows.
Results for two-way ANOVA in Excel: Summary statistics
As with one-way ANOVA, your results will come in two parts. The first part will be summary statistics about your groups. I’ve added the highlighting.
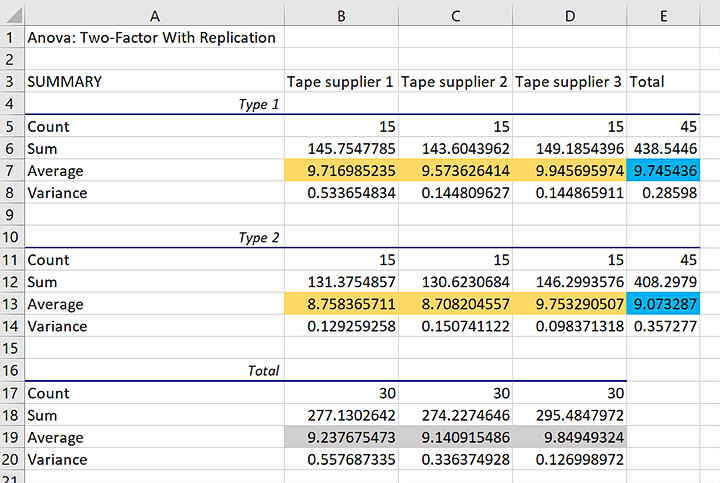
The blue highlighting shows the overall averages for the two different box types in the data. The difference is about 0.67 kilograms. The gray highlighting shows the averages for the 3 different tape suppliers. The averages for tape supplier 3 is closest to 10, while the averages for tape suppliers 1 and 2 are closer to 9.
The averages for the individual groups have gold highlighting. If the tapes from the different suppliers all work the same on both types of boxes, then the averages for the individual groups should follow the same patterns: The average for box type 1 should be higher and the average for tape supplier 3 should be higher.
The group averages show a different pattern than the overall averages for the two factors. Tape supplier 3’s average is higher than the other two because there is a larger difference between the suppliers for the second box type.
This comparison of the averages should prepare us for what to expect about the null hypothesis for two-way ANOVA that the factors do not affect the response variable.
Results for two-way ANOVA in Excel: Hypothesis tests
For our one-way ANOVA analysis, the p-value was relatively large. That value led us to conclude that we couldn’t be certain whether there was any difference between the tape suppliers.
For the two-way ANOVA, our largest p-value is about 0.002. That is much smaller than the traditional cutoff value for statistical significance of 0.05.
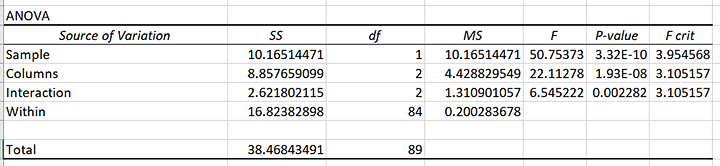
Because the p-value for the interaction is small, we cannot make a simple statement that one supplier or box type leads to a higher peel strength.
The hypothesis test confirms what we might have expected from the examination of the averages: The effect of the different tapes depends on the box type. (We could equivalently say that the effect of the different box types depends on the tape.)
From the default results in Excel, you can conclude that not all of the groups have the same peel strength. To make a more precise statement about the relationships among the groups, you should proceed to a multiple comparisons analysis.
Bonus tutorial: Selecting which hypothesis test to use
If you want to learn about the various types of hypothesis tests, then check out this video tutorial on hypothesis testing:
Free lesson from GoSkills Hypothesis Testing course by Ray Sheen, LSS BB
Conclusion
While the examination of the averages for the two-way ANOVA analysis suggests that the choice of tape matters only if you’re going to use the second box type, you’ll want to consider your decisions carefully from both a statistical and a practical perspective.
If you need the tape to have a peel strength of only 5 kilograms, then the peel strengths are probably all adequate. If a difference of 0.4 kilograms might lead you to choose one group over another, then more analysis of the data is in order.
You can learn more techniques for analyzing ANOVA data in this course on hypothesis testing. If you’ve already acquired the basics, then you’re ready to proceed to more advanced considerations in this design of experiments course. Either way, the knowledge that you gain will help you prepare to ensure that your projects exceed your expectations.